library(tidyverse) # An umbrella package that installs the tidyverse packages

library(readxl) # To read excel files

library(broom) # To tidy up the regression output

library(moderndive) # To get regression points

library(ggfortify) # To plot regression diagnostics

library(ggResidpanel) # To plot regression diagnosticsSpurious Regression
Zahid Asghar
Complete Blog on Spurious Regression
https://zahidasghar.com/timeseries/spurious_regression
Spurious Regression
\(y_t = a_0 + a_1z_t + e_t\)
where \(y_t\) is the dependent variable, \(z_t\) is the independent variable, \(a_0\) and \(a_1\) are the parameters, and \(e_t\) is the error term. Assumptions of the classical model:
both the {\(y_t\)} and {\(z_t\)} sequences be stationary
the errors have a zero mean and a finite variance.
In the presence of nonstationary variables, there might be what Granger and Newbold (1974) call a spurious regression.
A spurious regression has a high \(R^2\) and \(t\)-statistics that appear to be significant, but the results are without any economic meaning. The regression output “looks good” because the least-squares estimates are not consistent and the customary tests of statistical inference do not hold.
CASE 1: Both {yt} and {zt} are stationary. The classical regression model is appropriate.
CASE 2: The {yt} and {zt} sequences are integrated of different orders. Regression equations using such variables are meaningless.
CASE 3: The nonstationary {yt} and {zt} sequences are integrated of the same order and the residual sequence contains a stochastic trend. This is the case in which the regression is spurious. In this case, it is often recommended that the regression equation be estimated in first differences.
CASE 4: The nonstationary {yt} and {zt} sequences are integrated of the same order and the residual sequence is stationary. In this circumstance, {yt} and {zt} are cointegrated.
Load libraries and generate data
Simulate data
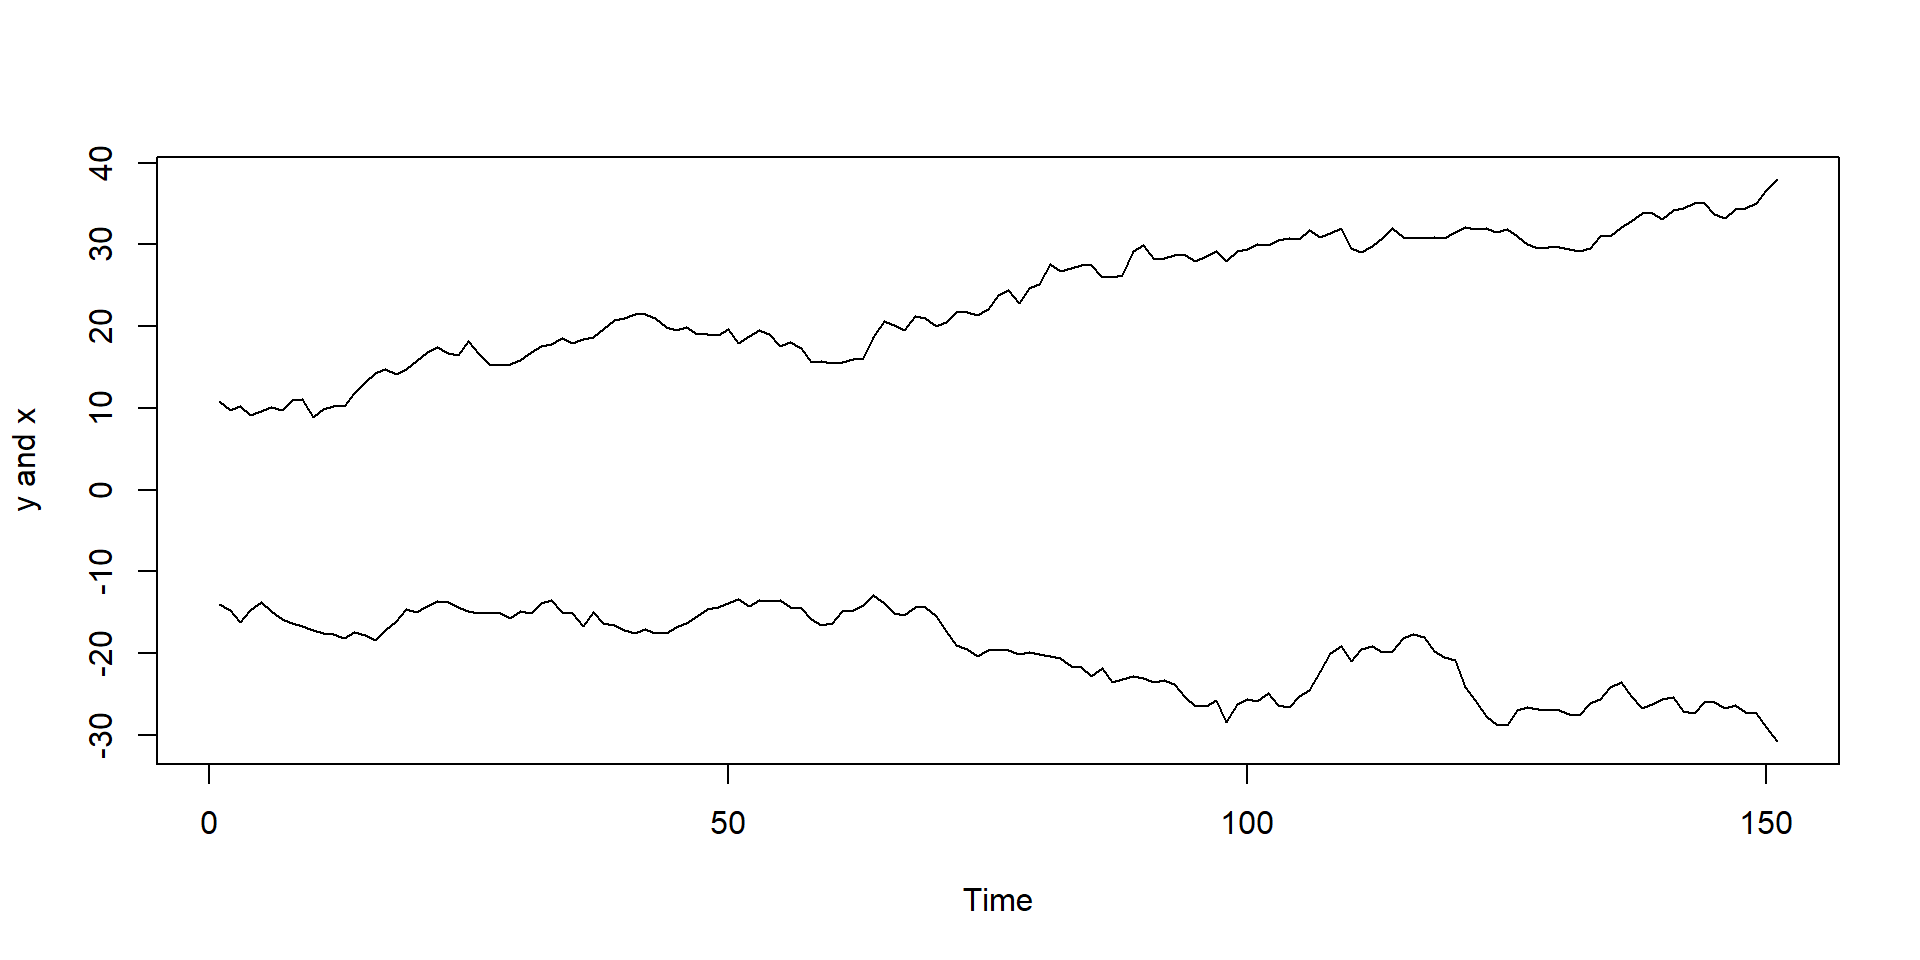
Plot the data
Call:
lm(formula = y ~ x)

Residuals:
    Min      1Q  Median      3Q     Max
-6.1121 -2.0348  0.1727  2.0074  6.1537

Coefficients:
            Estimate Std. Error t value Pr(>|t|)
(Intercept)  -7.1351     0.7252  -9.839   <2e-16 ***
x            -0.5410     0.0293 -18.464   <2e-16 ***
---
Signif. codes:  0 '***' 0.001 '**' 0.01 '*' 0.05 '.' 0.1 ' ' 1

Residual standard error: 2.737 on 149 degrees of freedom
Multiple R-squared:  0.6959,    Adjusted R-squared:  0.6938
F-statistic: 340.9 on 1 and 149 DF,  p-value: < 2.2e-16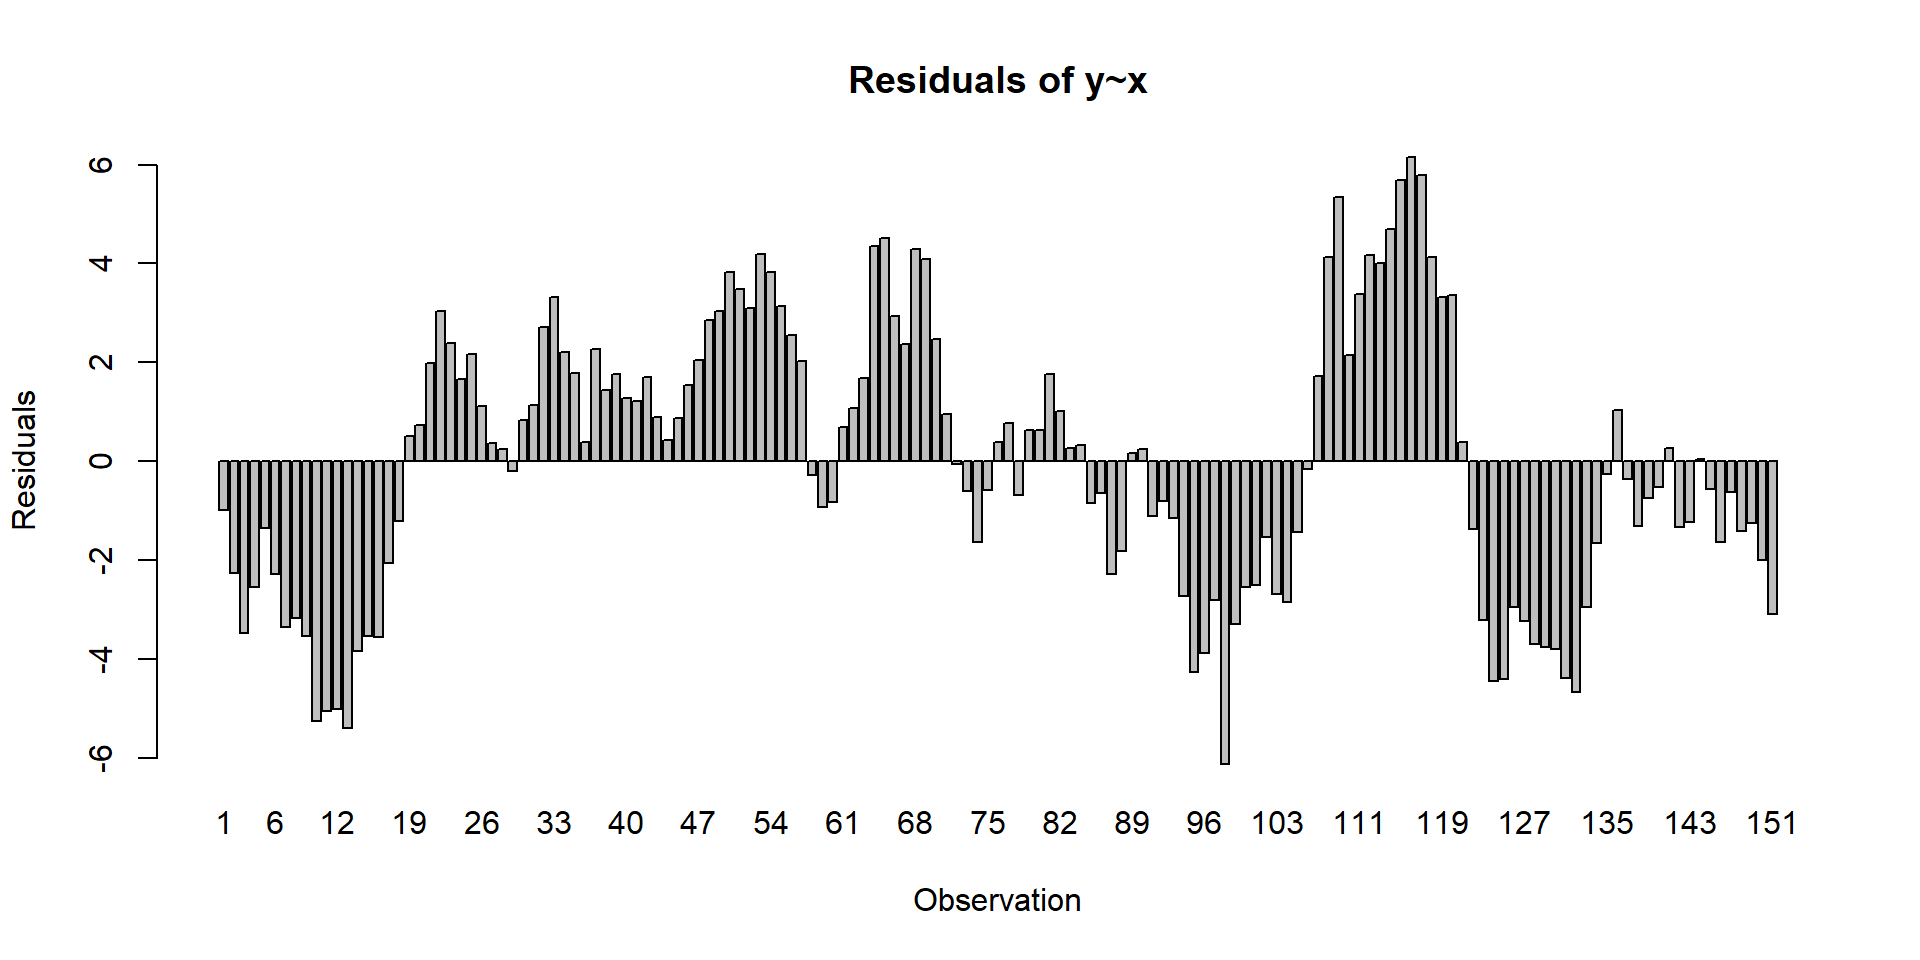
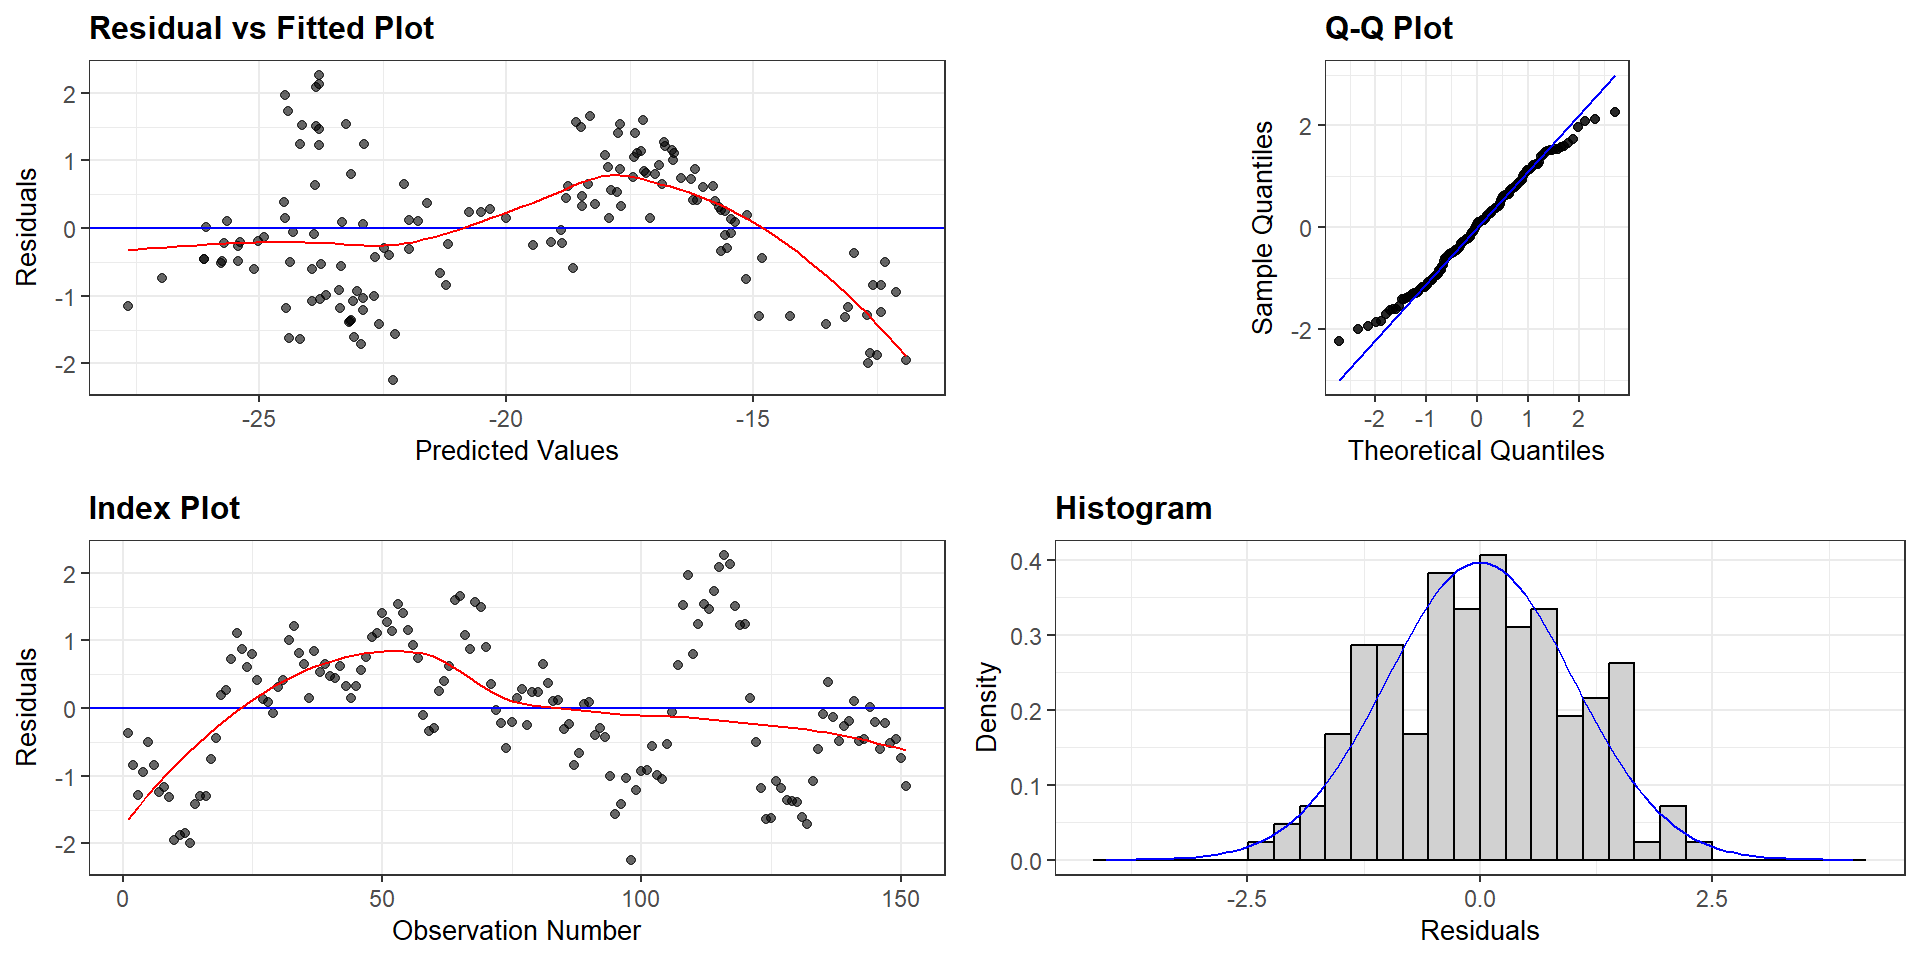
Residuals panel