ARDL Model for Denmark
Basic Example
This is a basic example which shows how to use the main functions of the ARDL package.
Assume that we want to model the LRM (logarithm of real money, M2) as a function of LRY, IBO and IDE (see ?denmark). The problem is that applying an OLS regression on non-stationary data would result into a spurious regression. The estimated parameters would be consistent only if the series were cointegrated.
First, we find the best ARDL specification. We search up to order 5.
models <- auto_ardl(LRM ~ LRY + IBO + IDE, data = denmark, max_order = 5)

# The top 20 models according to the AIC
models$top_orders
The best model is the one with the lowest AIC. We can also plot the AIC values for each model.
# The best model was found to be the ARDL(3,1,3,2)
ardl_3132 <- models$best_model
ardl_3132$order
LRM LRY IBO IDE
3 1 3 2 #> LRM LRY IBO IDE
#> 3 1 3 2
summary(ardl_3132)
Time series regression with "zooreg" data:
Start = 1974 Q4, End = 1987 Q3

Call:
dynlm::dynlm(formula = full_formula, data = data, start = start,
    end = end)

Residuals:
      Min        1Q    Median        3Q       Max
-0.029939 -0.008856 -0.002562  0.008190  0.072577

Coefficients:
            Estimate Std. Error t value Pr(>|t|)
(Intercept)   2.6202     0.5678   4.615 4.19e-05 ***
L(LRM, 1)     0.3192     0.1367   2.336 0.024735 *
L(LRM, 2)     0.5326     0.1324   4.024 0.000255 ***
L(LRM, 3)    -0.2687     0.1021  -2.631 0.012143 *
LRY           0.6728     0.1312   5.129 8.32e-06 ***
L(LRY, 1)    -0.2574     0.1472  -1.749 0.088146 .
IBO          -1.0785     0.3217  -3.353 0.001790 **
L(IBO, 1)    -0.1062     0.5858  -0.181 0.857081
L(IBO, 2)     0.2877     0.5691   0.505 0.616067
L(IBO, 3)    -0.9947     0.3925  -2.534 0.015401 *
IDE           0.1255     0.5545   0.226 0.822161
L(IDE, 1)    -0.3280     0.7213  -0.455 0.651847
L(IDE, 2)     1.4079     0.5520   2.550 0.014803 *
---
Signif. codes:  0 '***' 0.001 '**' 0.01 '*' 0.05 '.' 0.1 ' ' 1

Residual standard error: 0.0191 on 39 degrees of freedom
Multiple R-squared:  0.988, Adjusted R-squared:  0.9843
F-statistic: 266.8 on 12 and 39 DF,  p-value: < 2.2e-16
Then we can estimate the UECM (Unrestricted Error Correction Model) of the underlying ARDL(3,1,3,2).
Time series regression with "zooreg" data:
Start = 1974 Q4, End = 1987 Q3

Call:
dynlm::dynlm(formula = full_formula, data = data, start = start,
    end = end)

Residuals:
      Min        1Q    Median        3Q       Max
-0.029939 -0.008856 -0.002562  0.008190  0.072577

Coefficients:
             Estimate Std. Error t value Pr(>|t|)
(Intercept)   2.62019    0.56777   4.615 4.19e-05 ***
L(LRM, 1)    -0.41685    0.09166  -4.548 5.15e-05 ***
L(LRY, 1)     0.41538    0.11761   3.532  0.00108 **
L(IBO, 1)    -1.89172    0.39111  -4.837 2.09e-05 ***
L(IDE, 1)     1.20534    0.44690   2.697  0.01028 *
d(L(LRM, 1)) -0.26394    0.10192  -2.590  0.01343 *
d(L(LRM, 2))  0.26867    0.10213   2.631  0.01214 *
d(LRY)        0.67280    0.13116   5.129 8.32e-06 ***
d(IBO)       -1.07852    0.32170  -3.353  0.00179 **
d(L(IBO, 1))  0.70701    0.46874   1.508  0.13953
d(L(IBO, 2))  0.99468    0.39251   2.534  0.01540 *
d(IDE)        0.12546    0.55445   0.226  0.82216
d(L(IDE, 1)) -1.40786    0.55204  -2.550  0.01480 *
---
Signif. codes:  0 '***' 0.001 '**' 0.01 '*' 0.05 '.' 0.1 ' ' 1

Residual standard error: 0.0191 on 39 degrees of freedom
Multiple R-squared:  0.7458,    Adjusted R-squared:  0.6676
F-statistic: 9.537 on 12 and 39 DF,  p-value: 3.001e-08
And also the RECM (Restricted Error Correction Model) of the underlying ARDL(3,1,3,2), allowing the constant to join the long-run relationship (case 2), instead of the short-run (case 3).
Time series regression with "zooreg" data:
Start = 1974 Q4, End = 1987 Q3

Call:
dynlm::dynlm(formula = full_formula, data = data, start = start,
    end = end)

Residuals:
      Min        1Q    Median        3Q       Max
-0.029939 -0.008856 -0.002562  0.008190  0.072577

Coefficients:
             Estimate Std. Error t value Pr(>|t|)
d(L(LRM, 1)) -0.26394    0.09008  -2.930 0.005405 **
d(L(LRM, 2))  0.26867    0.09127   2.944 0.005214 **
d(LRY)        0.67280    0.11591   5.805 7.03e-07 ***
d(IBO)       -1.07852    0.30025  -3.592 0.000837 ***
d(L(IBO, 1))  0.70701    0.44359   1.594 0.118300
d(L(IBO, 2))  0.99468    0.36491   2.726 0.009242 **
d(IDE)        0.12546    0.48290   0.260 0.796248
d(L(IDE, 1)) -1.40786    0.48867  -2.881 0.006160 **
ect          -0.41685    0.07849  -5.311 3.63e-06 ***
---
Signif. codes:  0 '***' 0.001 '**' 0.01 '*' 0.05 '.' 0.1 ' ' 1

Residual standard error: 0.01819 on 43 degrees of freedom
  (0 observations deleted due to missingness)
Multiple R-squared:  0.7613,    Adjusted R-squared:  0.7113
F-statistic: 15.24 on 9 and 43 DF,  p-value: 9.545e-11
Finally, we can test the stability of the coefficients of the ARDL(3,1,3,2) model. As discussed earlier @fig-
Let’s test if there is a long-run levels relationship (cointegration) using the bounds test from Pesaran et al. (2001).
The bounds F-test (under the case 2) rejects the NULL hypothesis (let’s say, assuming alpha = 0.01) with p-value = 0.004418.
bounds_f_test(ardl_3132, case = 2)
    Bounds F-test (Wald) for no cointegration

data:  d(LRM) ~ L(LRM, 1) + L(LRY, 1) + L(IBO, 1) + L(IDE, 1) + d(L(LRM,     1)) + d(L(LRM, 2)) + d(LRY) + d(IBO) + d(L(IBO, 1)) + d(L(IBO,     2)) + d(IDE) + d(L(IDE, 1))
F = 5.1168, p-value = 0.004418
alternative hypothesis: Possible cointegration
null values:
   k    T
   3 1000
The bounds F-test rejects the NULL hypothesis of no cointegration. Therefore, we can conclude that there is a long-run relationship between the series.
# The bounds F-test (under the case 3) rejects the NULL hypothesis (let's say, assuming alpha = 0.01) with p-value = 0.004418.
bounds_f_test(ardl_3132, case = 3)
    Bounds F-test (Wald) for no cointegration

data:  d(LRM) ~ L(LRM, 1) + L(LRY, 1) + L(IBO, 1) + L(IDE, 1) + d(L(LRM,     1)) + d(L(LRM, 2)) + d(LRY) + d(IBO) + d(L(IBO, 1)) + d(L(IBO,     2)) + d(IDE) + d(L(IDE, 1))
F = 6.2059, p-value = 0.004146
alternative hypothesis: Possible cointegration
null values:
   k    T
   3 1000
# The bounds t-test (under the case 3) rejects the NULL hypothesis (let's say, assuming alpha = 0.01) with p-value = 0.005538.
# We also provide the critical value bounds for alpha = 0.01.
tbounds <- bounds_t_test(uecm_3132, case = 3, alpha = 0.01)
tbounds
    Bounds t-test for no cointegration

data:  d(LRM) ~ L(LRM, 1) + L(LRY, 1) + L(IBO, 1) + L(IDE, 1) + d(L(LRM,     1)) + d(L(LRM, 2)) + d(LRY) + d(IBO) + d(L(IBO, 1)) + d(L(IBO,     2)) + d(IDE) + d(L(IDE, 1))
t = -4.5479, Lower-bound I(0) = -3.4430, Upper-bound I(1) = -4.3799,
p-value = 0.005538
alternative hypothesis: Possible cointegration
null values:
   k    T
3 1000 tbounds$tabHere we have the short-run and the long-run multipliers (with standard errors, t-statistics and p-values).
multipliers(ardl_3132, type = "sr")We can also estimate and visualize the delay multipliers along with their standard errors.
mult15 <- multipliers(ardl_3132, type = 15, se = TRUE)
plot_delay(mult15, interval = 0.95)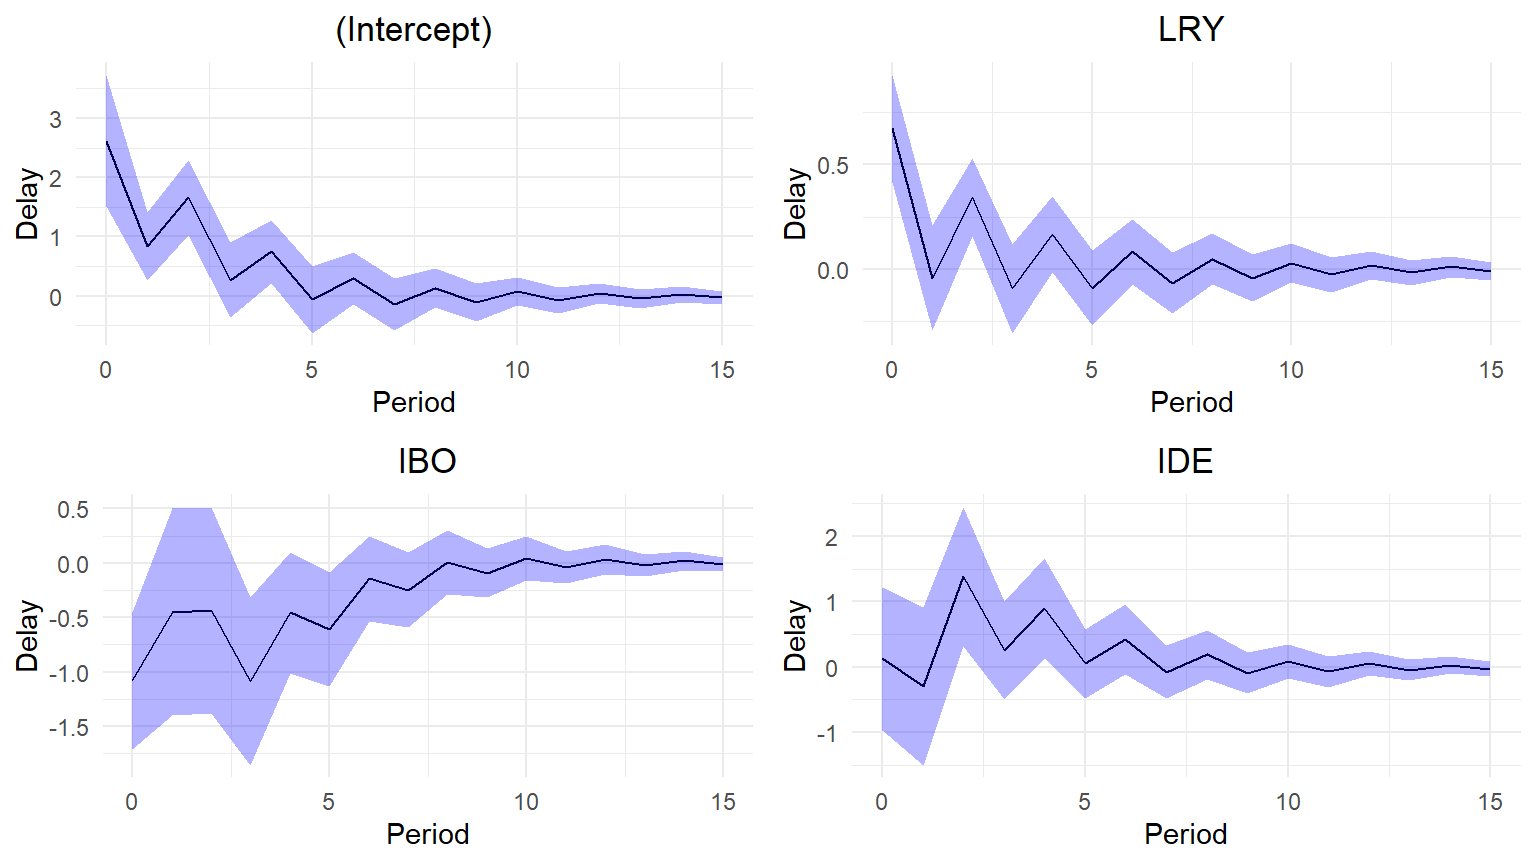
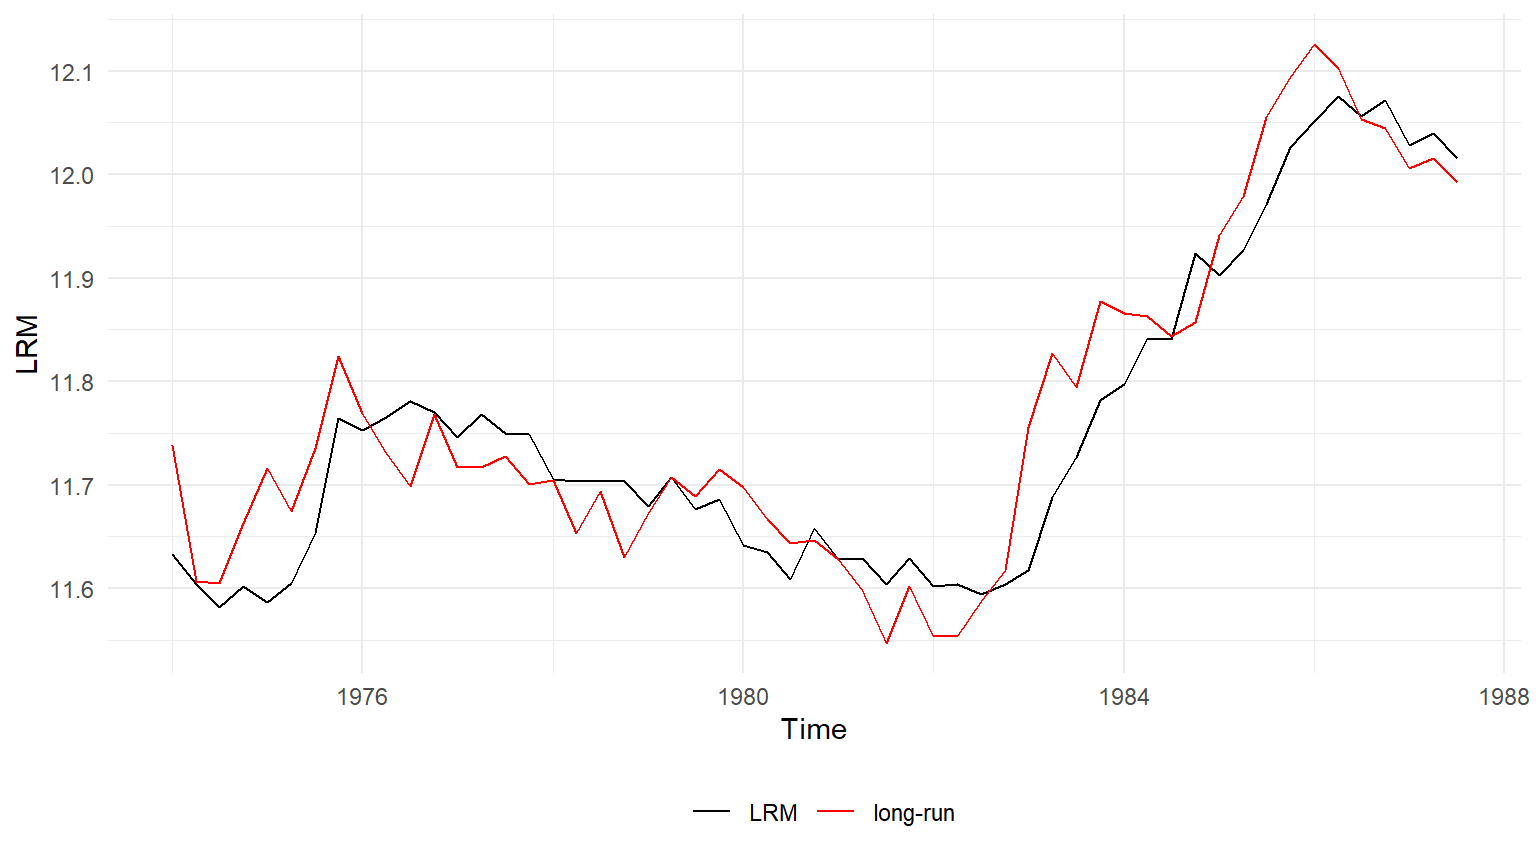
Now let’s graphically check the estimated long-run relationship (cointegrating equation) against the dependent variable LRM.
Finally, we can forecast the dependent variable LRM using the ARDL(3,1,3,2) model.
Forecasting and using an ardl, uecm, or recm model in other functions are easy as they can be converted in regular lm models.
ardl_3132_lm <- to_lm(ardl_3132)

# Forecast using the in-sample data
insample_data <- ardl_3132$model
predicted_values <- predict(ardl_3132_lm, newdata = insample_data)

# Convert to ts class for the plot
predicted_values <- ts(predicted_values, start = c(1974,4), frequency=4)
plot(denmark$LRM, lwd=2) #The input dependent variable
lines(predicted_values, col="red", lwd=2) #The predicted values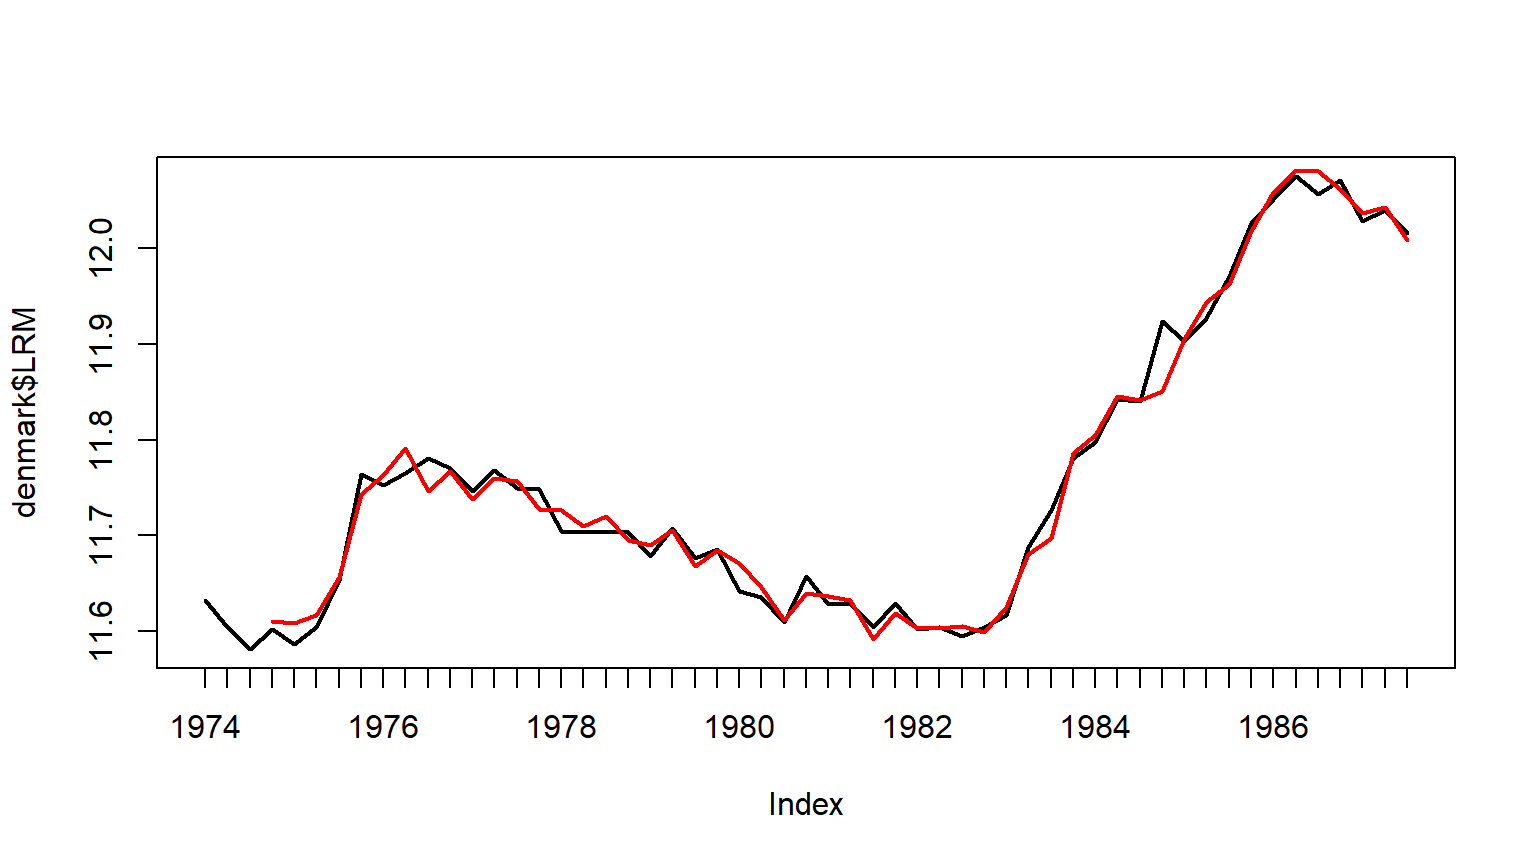
As per Figure 1, the red line represents the forecasted values of the dependent variable LRM using the ARDL(3,1,3,2) model. Similarly we do this in ?@sec-ease-of-use.
Ease of use
Let’s see what it takes to build the above ARDL(3,1,3,2) model.
Using the ARDL package (literally one line of code):
Without the ARDL package: (Using the dynlm package, because striving with the lm function would require extra data transformation to behave like time-series)
[1] TRUEAn ARDL model has a relatively simple structure, although the difference in typing effort is noticeable. Figure 1 shows the multipliers of the ARDL(3,1,3,2) model.
Not to mention the complex transformation for an ECM. The extra typing is the least of your problems trying to do this. First you would need to figure out the exact structure of the model!
Using the ARDL package (literally one line of code):
uecm_model <- uecm(ardl_model)Without the ARDL package: