This is an R Markdown document. Markdown is a simple formatting syntax for authoring HTML, PDF, and MS Word documents. For more details on using R Markdown see http://rmarkdown.rstudio.com .
Warning: package 'ISLR' was built under R version 4.5.1
     AtBat            Hits         HmRun            Runs
 Min.   : 16.0   Min.   :  1   Min.   : 0.00   Min.   :  0.00
 1st Qu.:255.2   1st Qu.: 64   1st Qu.: 4.00   1st Qu.: 30.25
 Median :379.5   Median : 96   Median : 8.00   Median : 48.00
 Mean   :380.9   Mean   :101   Mean   :10.77   Mean   : 50.91
 3rd Qu.:512.0   3rd Qu.:137   3rd Qu.:16.00   3rd Qu.: 69.00
 Max.   :687.0   Max.   :238   Max.   :40.00   Max.   :130.00

      RBI             Walks            Years            CAtBat
 Min.   :  0.00   Min.   :  0.00   Min.   : 1.000   Min.   :   19.0
 1st Qu.: 28.00   1st Qu.: 22.00   1st Qu.: 4.000   1st Qu.:  816.8
 Median : 44.00   Median : 35.00   Median : 6.000   Median : 1928.0
 Mean   : 48.03   Mean   : 38.74   Mean   : 7.444   Mean   : 2648.7
 3rd Qu.: 64.75   3rd Qu.: 53.00   3rd Qu.:11.000   3rd Qu.: 3924.2
 Max.   :121.00   Max.   :105.00   Max.   :24.000   Max.   :14053.0

     CHits            CHmRun           CRuns             CRBI
 Min.   :   4.0   Min.   :  0.00   Min.   :   1.0   Min.   :   0.00
 1st Qu.: 209.0   1st Qu.: 14.00   1st Qu.: 100.2   1st Qu.:  88.75
 Median : 508.0   Median : 37.50   Median : 247.0   Median : 220.50
 Mean   : 717.6   Mean   : 69.49   Mean   : 358.8   Mean   : 330.12
 3rd Qu.:1059.2   3rd Qu.: 90.00   3rd Qu.: 526.2   3rd Qu.: 426.25
 Max.   :4256.0   Max.   :548.00   Max.   :2165.0   Max.   :1659.00

     CWalks        League  Division    PutOuts          Assists
 Min.   :   0.00   A:175   E:157    Min.   :   0.0   Min.   :  0.0
 1st Qu.:  67.25   N:147   W:165    1st Qu.: 109.2   1st Qu.:  7.0
 Median : 170.50                    Median : 212.0   Median : 39.5
 Mean   : 260.24                    Mean   : 288.9   Mean   :106.9
 3rd Qu.: 339.25                    3rd Qu.: 325.0   3rd Qu.:166.0
 Max.   :1566.00                    Max.   :1378.0   Max.   :492.0

     Errors          Salary       NewLeague
 Min.   : 0.00   Min.   :  67.5   A:176
 1st Qu.: 3.00   1st Qu.: 190.0   N:146
 Median : 6.00   Median : 425.0
 Mean   : 8.04   Mean   : 535.9
 3rd Qu.:11.00   3rd Qu.: 750.0
 Max.   :32.00   Max.   :2460.0
                 NA's   :59
There are some missing values, so before we process we need to remove these missing values
= na.omit (Hitters)with (Hitters,sum (is.na (Salary)))
Best Subset Regressions We shall use library leaps for best subset model
library (leaps)= regsubsets (Salary~ .,data= Hitters)summary (regfit.full)
Subset selection object
Call: regsubsets.formula(Salary ~ ., data = Hitters)
19 Variables  (and intercept)
           Forced in Forced out
AtBat          FALSE      FALSE
Hits           FALSE      FALSE
HmRun          FALSE      FALSE
Runs           FALSE      FALSE
RBI            FALSE      FALSE
Walks          FALSE      FALSE
Years          FALSE      FALSE
CAtBat         FALSE      FALSE
CHits          FALSE      FALSE
CHmRun         FALSE      FALSE
CRuns          FALSE      FALSE
CRBI           FALSE      FALSE
CWalks         FALSE      FALSE
LeagueN        FALSE      FALSE
DivisionW      FALSE      FALSE
PutOuts        FALSE      FALSE
Assists        FALSE      FALSE
Errors         FALSE      FALSE
NewLeagueN     FALSE      FALSE
1 subsets of each size up to 8
Selection Algorithm: exhaustive
         AtBat Hits HmRun Runs RBI Walks Years CAtBat CHits CHmRun CRuns CRBI
1  ( 1 ) " "   " "  " "   " "  " " " "   " "   " "    " "   " "    " "   "*"
2  ( 1 ) " "   "*"  " "   " "  " " " "   " "   " "    " "   " "    " "   "*"
3  ( 1 ) " "   "*"  " "   " "  " " " "   " "   " "    " "   " "    " "   "*"
4  ( 1 ) " "   "*"  " "   " "  " " " "   " "   " "    " "   " "    " "   "*"
5  ( 1 ) "*"   "*"  " "   " "  " " " "   " "   " "    " "   " "    " "   "*"
6  ( 1 ) "*"   "*"  " "   " "  " " "*"   " "   " "    " "   " "    " "   "*"
7  ( 1 ) " "   "*"  " "   " "  " " "*"   " "   "*"    "*"   "*"    " "   " "
8  ( 1 ) "*"   "*"  " "   " "  " " "*"   " "   " "    " "   "*"    "*"   " "
         CWalks LeagueN DivisionW PutOuts Assists Errors NewLeagueN
1  ( 1 ) " "    " "     " "       " "     " "     " "    " "
2  ( 1 ) " "    " "     " "       " "     " "     " "    " "
3  ( 1 ) " "    " "     " "       "*"     " "     " "    " "
4  ( 1 ) " "    " "     "*"       "*"     " "     " "    " "
5  ( 1 ) " "    " "     "*"       "*"     " "     " "    " "
6  ( 1 ) " "    " "     "*"       "*"     " "     " "    " "
7  ( 1 ) " "    " "     "*"       "*"     " "     " "    " "
8  ( 1 ) "*"    " "     "*"       "*"     " "     " "    " "
It gives a summary upto 8 by default but if want full summary of all 19 variables
= regsubsets (Salary~ .,data= Hitters,nvmax= 19 )= summary (regfit.full)names (reg.summary)
[1] "which" "rsq" "rss" "adjr2" "cp" "bic" "outmat" "obj"
 [1] 0.3214501 0.4252237 0.4514294 0.4754067 0.4908036 0.5087146 0.5141227
 [8] 0.5285569 0.5346124 0.5404950 0.5426153 0.5436302 0.5444570 0.5452164
[15] 0.5454692 0.5457656 0.5459518 0.5460945 0.5461159
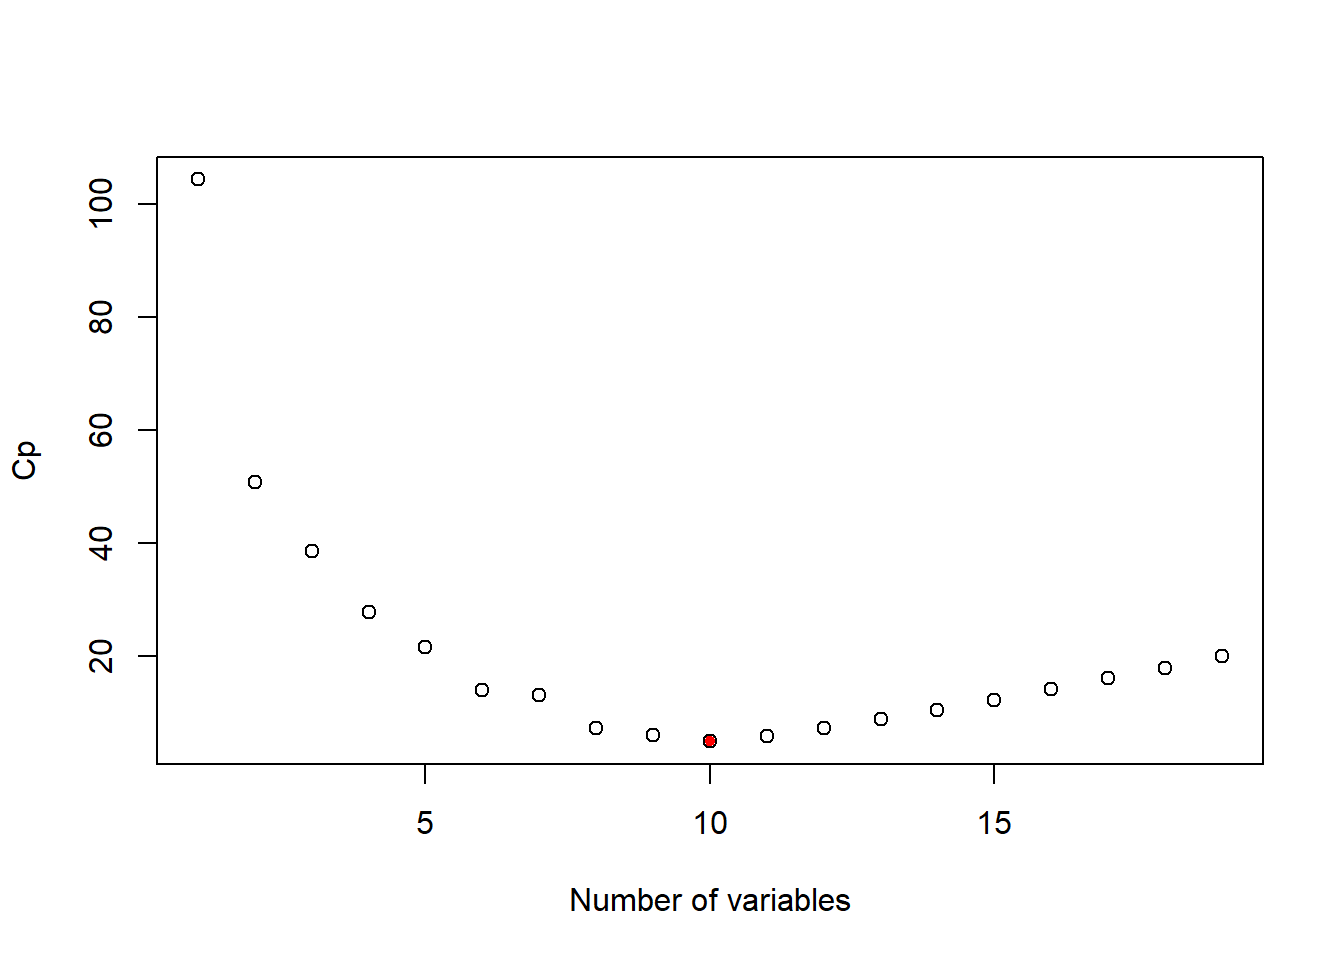
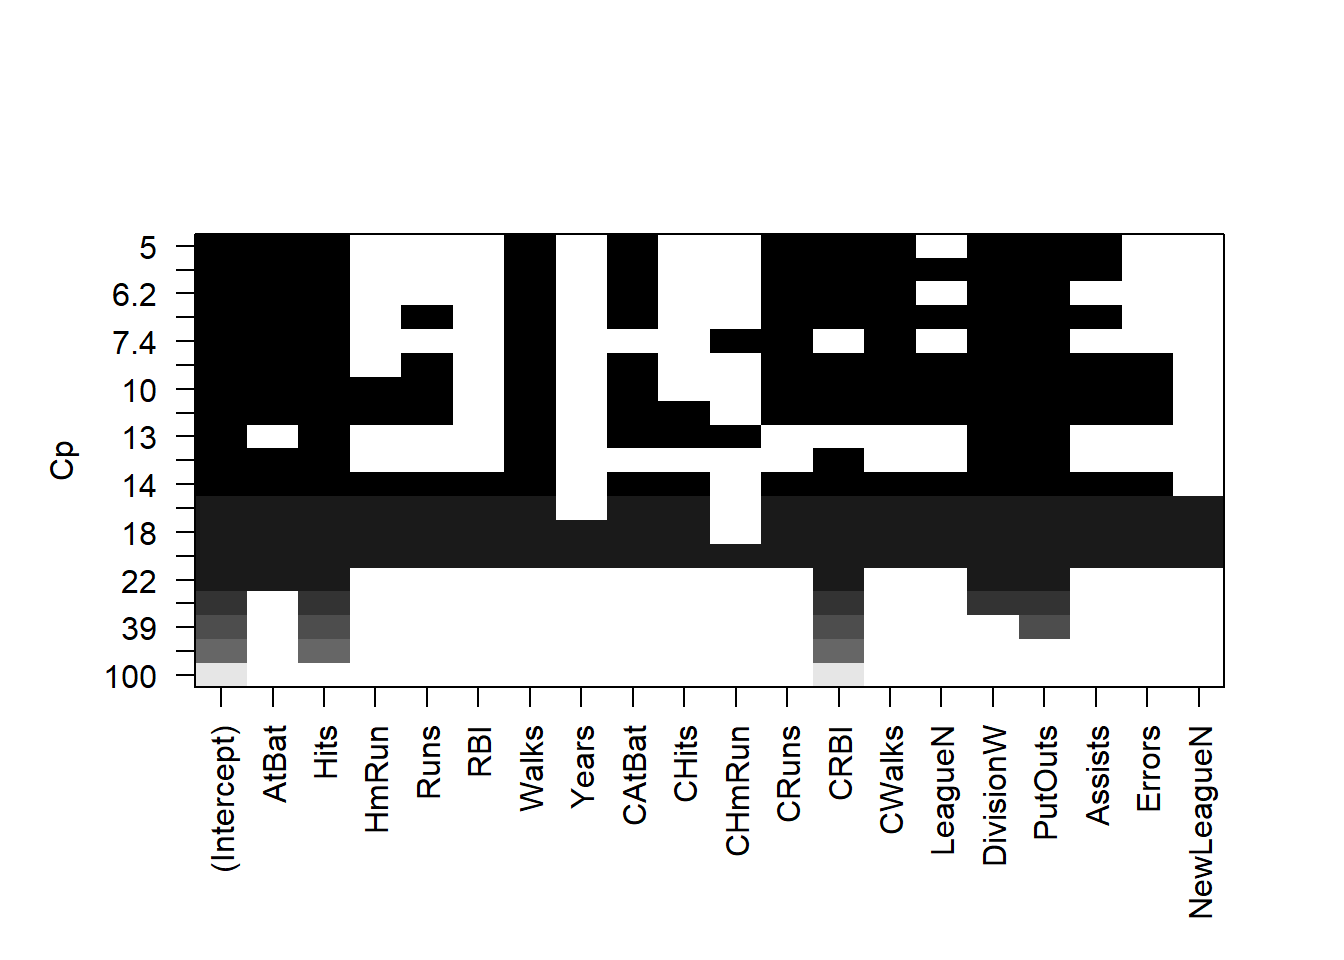
library (ggplot2)plot (reg.summary$ cp,xlab = "Number of variables" ,ylab = "Cp" )which.min (reg.summary$ cp)points (10 ,reg.summary$ cp[10 ],pch= 20 ,col= "red" )plot (regfit.full,scale= "Cp" )
 (Intercept)        AtBat         Hits        Walks       CAtBat        CRuns
 162.5354420   -2.1686501    6.9180175    5.7732246   -0.1300798    1.4082490
        CRBI       CWalks    DivisionW      PutOuts      Assists
   0.7743122   -0.8308264 -112.3800575    0.2973726    0.2831680
Forward Selection Procedure Here we use the regsubsets function but specify the `method=“forward” option:
= regsubsets (Salary~ .,data= Hitters,nvmax= 19 ,method= "forward" )summary (regfit.fwd)
Subset selection object
Call: regsubsets.formula(Salary ~ ., data = Hitters, nvmax = 19, method = "forward")
19 Variables  (and intercept)
           Forced in Forced out
AtBat          FALSE      FALSE
Hits           FALSE      FALSE
HmRun          FALSE      FALSE
Runs           FALSE      FALSE
RBI            FALSE      FALSE
Walks          FALSE      FALSE
Years          FALSE      FALSE
CAtBat         FALSE      FALSE
CHits          FALSE      FALSE
CHmRun         FALSE      FALSE
CRuns          FALSE      FALSE
CRBI           FALSE      FALSE
CWalks         FALSE      FALSE
LeagueN        FALSE      FALSE
DivisionW      FALSE      FALSE
PutOuts        FALSE      FALSE
Assists        FALSE      FALSE
Errors         FALSE      FALSE
NewLeagueN     FALSE      FALSE
1 subsets of each size up to 19
Selection Algorithm: forward
          AtBat Hits HmRun Runs RBI Walks Years CAtBat CHits CHmRun CRuns CRBI
1  ( 1 )  " "   " "  " "   " "  " " " "   " "   " "    " "   " "    " "   "*"
2  ( 1 )  " "   "*"  " "   " "  " " " "   " "   " "    " "   " "    " "   "*"
3  ( 1 )  " "   "*"  " "   " "  " " " "   " "   " "    " "   " "    " "   "*"
4  ( 1 )  " "   "*"  " "   " "  " " " "   " "   " "    " "   " "    " "   "*"
5  ( 1 )  "*"   "*"  " "   " "  " " " "   " "   " "    " "   " "    " "   "*"
6  ( 1 )  "*"   "*"  " "   " "  " " "*"   " "   " "    " "   " "    " "   "*"
7  ( 1 )  "*"   "*"  " "   " "  " " "*"   " "   " "    " "   " "    " "   "*"
8  ( 1 )  "*"   "*"  " "   " "  " " "*"   " "   " "    " "   " "    "*"   "*"
9  ( 1 )  "*"   "*"  " "   " "  " " "*"   " "   "*"    " "   " "    "*"   "*"
10  ( 1 ) "*"   "*"  " "   " "  " " "*"   " "   "*"    " "   " "    "*"   "*"
11  ( 1 ) "*"   "*"  " "   " "  " " "*"   " "   "*"    " "   " "    "*"   "*"
12  ( 1 ) "*"   "*"  " "   "*"  " " "*"   " "   "*"    " "   " "    "*"   "*"
13  ( 1 ) "*"   "*"  " "   "*"  " " "*"   " "   "*"    " "   " "    "*"   "*"
14  ( 1 ) "*"   "*"  "*"   "*"  " " "*"   " "   "*"    " "   " "    "*"   "*"
15  ( 1 ) "*"   "*"  "*"   "*"  " " "*"   " "   "*"    "*"   " "    "*"   "*"
16  ( 1 ) "*"   "*"  "*"   "*"  "*" "*"   " "   "*"    "*"   " "    "*"   "*"
17  ( 1 ) "*"   "*"  "*"   "*"  "*" "*"   " "   "*"    "*"   " "    "*"   "*"
18  ( 1 ) "*"   "*"  "*"   "*"  "*" "*"   "*"   "*"    "*"   " "    "*"   "*"
19  ( 1 ) "*"   "*"  "*"   "*"  "*" "*"   "*"   "*"    "*"   "*"    "*"   "*"
          CWalks LeagueN DivisionW PutOuts Assists Errors NewLeagueN
1  ( 1 )  " "    " "     " "       " "     " "     " "    " "
2  ( 1 )  " "    " "     " "       " "     " "     " "    " "
3  ( 1 )  " "    " "     " "       "*"     " "     " "    " "
4  ( 1 )  " "    " "     "*"       "*"     " "     " "    " "
5  ( 1 )  " "    " "     "*"       "*"     " "     " "    " "
6  ( 1 )  " "    " "     "*"       "*"     " "     " "    " "
7  ( 1 )  "*"    " "     "*"       "*"     " "     " "    " "
8  ( 1 )  "*"    " "     "*"       "*"     " "     " "    " "
9  ( 1 )  "*"    " "     "*"       "*"     " "     " "    " "
10  ( 1 ) "*"    " "     "*"       "*"     "*"     " "    " "
11  ( 1 ) "*"    "*"     "*"       "*"     "*"     " "    " "
12  ( 1 ) "*"    "*"     "*"       "*"     "*"     " "    " "
13  ( 1 ) "*"    "*"     "*"       "*"     "*"     "*"    " "
14  ( 1 ) "*"    "*"     "*"       "*"     "*"     "*"    " "
15  ( 1 ) "*"    "*"     "*"       "*"     "*"     "*"    " "
16  ( 1 ) "*"    "*"     "*"       "*"     "*"     "*"    " "
17  ( 1 ) "*"    "*"     "*"       "*"     "*"     "*"    "*"
18  ( 1 ) "*"    "*"     "*"       "*"     "*"     "*"    "*"
19  ( 1 ) "*"    "*"     "*"       "*"     "*"     "*"    "*"
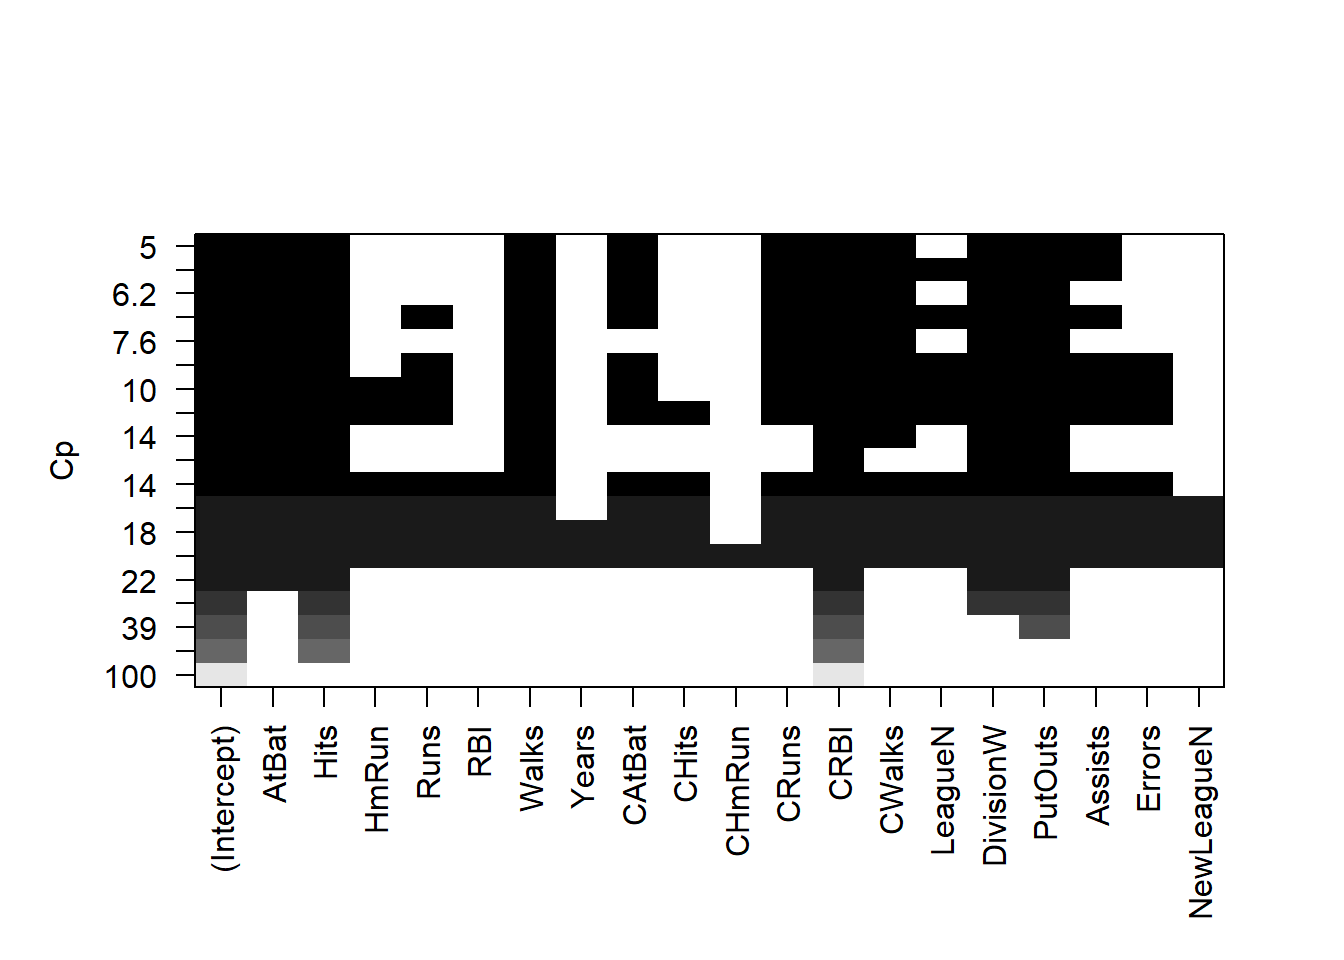
plot (regfit.fwd,scale= "Cp" )
Model Selection Using a Validation Set Lets make a training and validation set, so that we can choose a good subset model. We will do it using a slightly different approach from what was done in the the book.
set.seed (1 )= sample (seq (263 ),180 ,replace= FALSE )
  [1] 167 129 187  85  79 213  37 105 217 110 229 165  34 106 126  89 172 207
 [19]  33  84 163  70  74  42 166 111 148 156  20  44 121  87 242 233  40 247
 [37]  25 119 198 122  39 179 240 134  24 160  14 130  45 146  22 206 193 115
 [55] 104 231 208 209 103  75  13 253 176 248  23 254 244 205  29 141 150 236
 [73] 108  48 245 215 149  31 102 145  73 232  83 118  90 190 107  64 196  60
 [91]  51 251 138 262  43  26 143 195 152 178 223 219 202 181 222 169   1 239
[109]  78 211 246  28 116 257  61 113  86  71 225  99 173 234  49 256 174 194
[127]  50 135 238 235 230 263  53 100 164  65 142 175 140 124 224  77 159  98
[145]  66  19  17 228 204 186  35 144  46 180 109 210  16 161   9 137  92 162
[163]  10 259  32 243  95 154  93  12 255 177  15   2 128  67 183 117 197   5
= regsubsets (Salary~ .,data= Hitters[train,],nvmax= 19 ,method= "forward" )
Now we will make predictions on the observations not used for training. We know there are 19 models, so we set up some vectors to record the errors. We have to do a bit of work here, because there is no predict method for regsubsets.
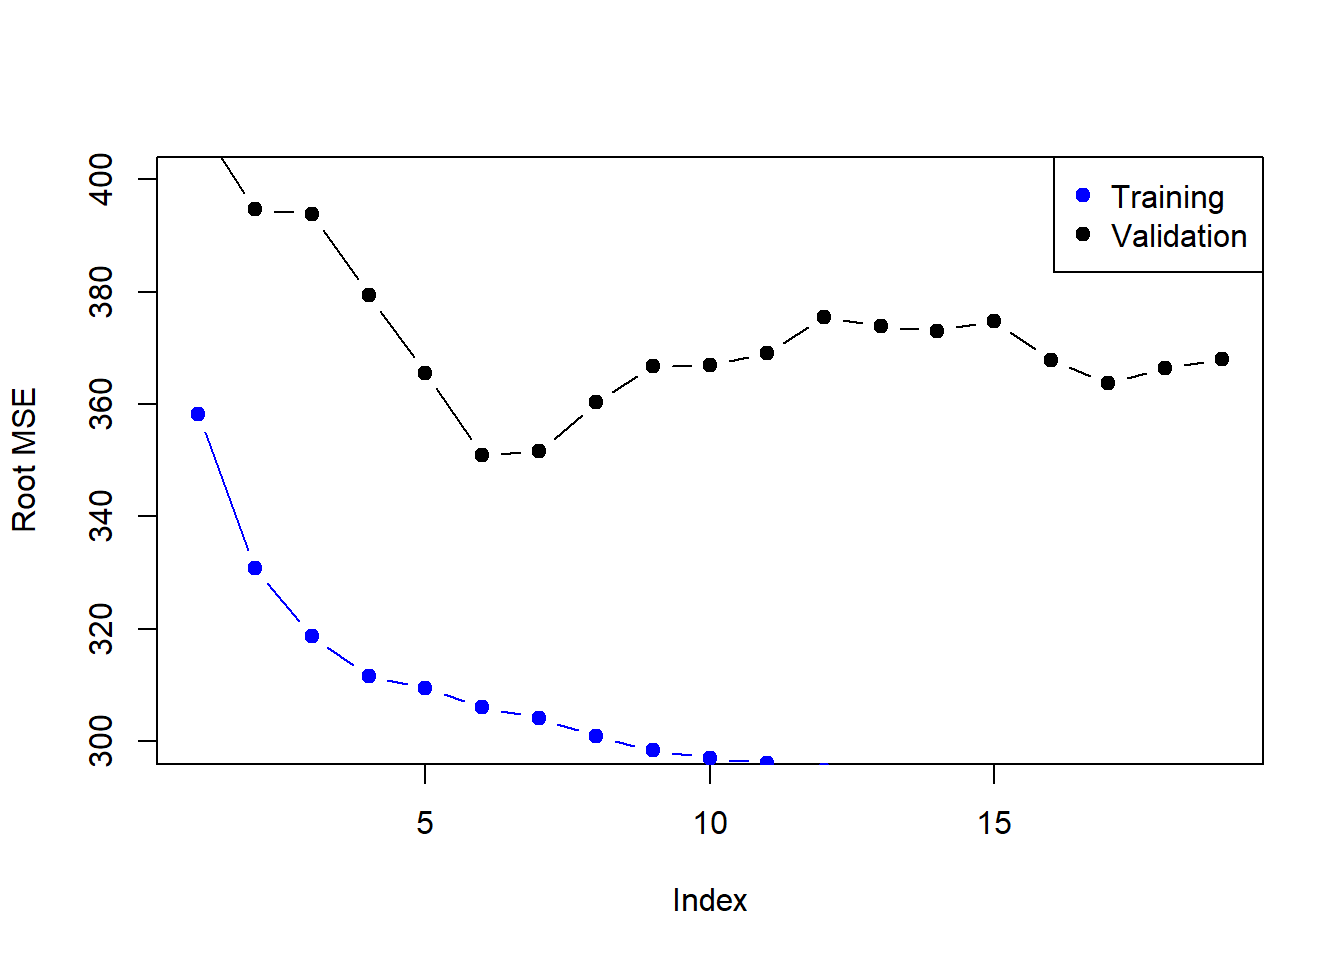
= rep (NA ,19 )= model.matrix (Salary~ .,data= Hitters[- train,])# notice the -index! for (i in 1 : 19 ){= coef (regfit.fwd,id= i)= x.test[,names (coefi)]%*% coefi= mean ((Hitters$ Salary[- train]- pred)^ 2 )plot (sqrt (val.errors),ylab= "Root MSE" ,ylim= c (300 ,400 ),pch= 19 ,type= "b" )points (sqrt (regfit.fwd$ rss[- 1 ]/ 180 ),col= "blue" ,pch= 19 ,type= "b" )legend ("topright" ,legend= c ("Training" ,"Validation" ),col= c ("blue" ,"black" ),pch= 19 )
down monotonically as the model gets bigger, but not so for the validation error.
This was a little tedious - not having a predict method for regsubsets. So we will write one!
= function (object,newdata,id,...){= as.formula (object$ call[[2 ]])= model.matrix (form,newdata)= coef (object,id= id)names (coefi)]%*% coefi
Model Selection by Cross-Validation We will do 10-fold cross-validation. Its really easy!
set.seed (11 )= sample (rep (1 : 10 ,length= nrow (Hitters)))
  [1] 10  4  4  4  3  7 10  8 10  3  4  2  2  1  1  5  3  3  5  9  5  2  7  3  8
 [26]  7  4  6  7  7  7 10  2  6  6  1  8  8 10  1  8  3  7 10  1  6 10  3  8  7
 [51]  9  3  6  2  5  6  5  5  2  6  4  7 10  7  1  8  1  2  8  2  1  8  2  6  4
 [76]  3  1  1  5  1  2 10  5  8  8  3  9  8  3  6  1  9  5  9  9  8  8  6  8 10
[101]  9  8  7  8 10  1  3  1 10  5  2  5  2  4  4 10  3  6  9  7  4  3  9  8 10
[126]  7  5  9 10  4  7  4  1  9  4  5  6  8 10  6  7  1 10  6  4  6  7  1  9  4
[151]  2  1  7  2  5  7 10  7  9  6  9  5  5  4 10  4  2 10  9  3  3  2  9  2  6
[176]  9  4  3  9  9  9  4  6  1  7  8  5  8 10  6  9  8  9  1  5  3  3  1  7  1
[201]  2  9  1  9 10  3 10  3  4  6  8  2  9  5  7  2 10  4  1  6 10  3  5  5  3
[226]  5  7  3  6  5  4  1  3  7  1  5  2  9  4  6  8  3  2  4  5 10  8  5  2  2
[251]  2  6  3  4  7  2  6  4  8  7  1  2  6
Ridge Regression and the Lasso We will use the package glmnet, which does not use the model formula language, so we will set up an x and y.
#install.packages("glmnet") library (glmnet)
Warning: package 'glmnet' was built under R version 4.5.1
Loading required package: Matrix
Warning: package 'Matrix' was built under R version 4.5.1
= model.matrix (Salary~ .- 1 ,data= Hitters) = Hitters$ Salary
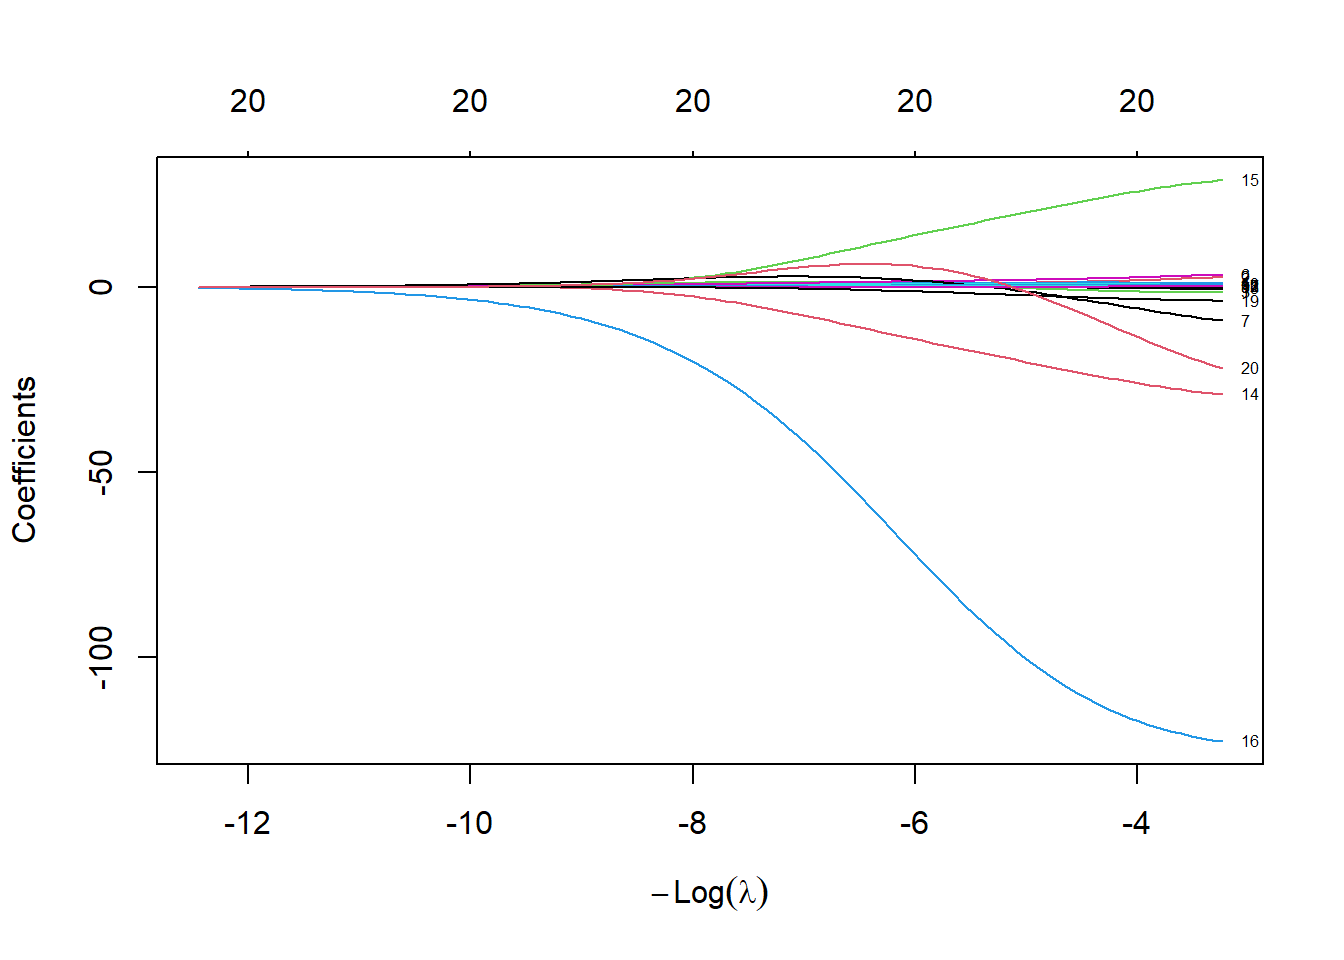
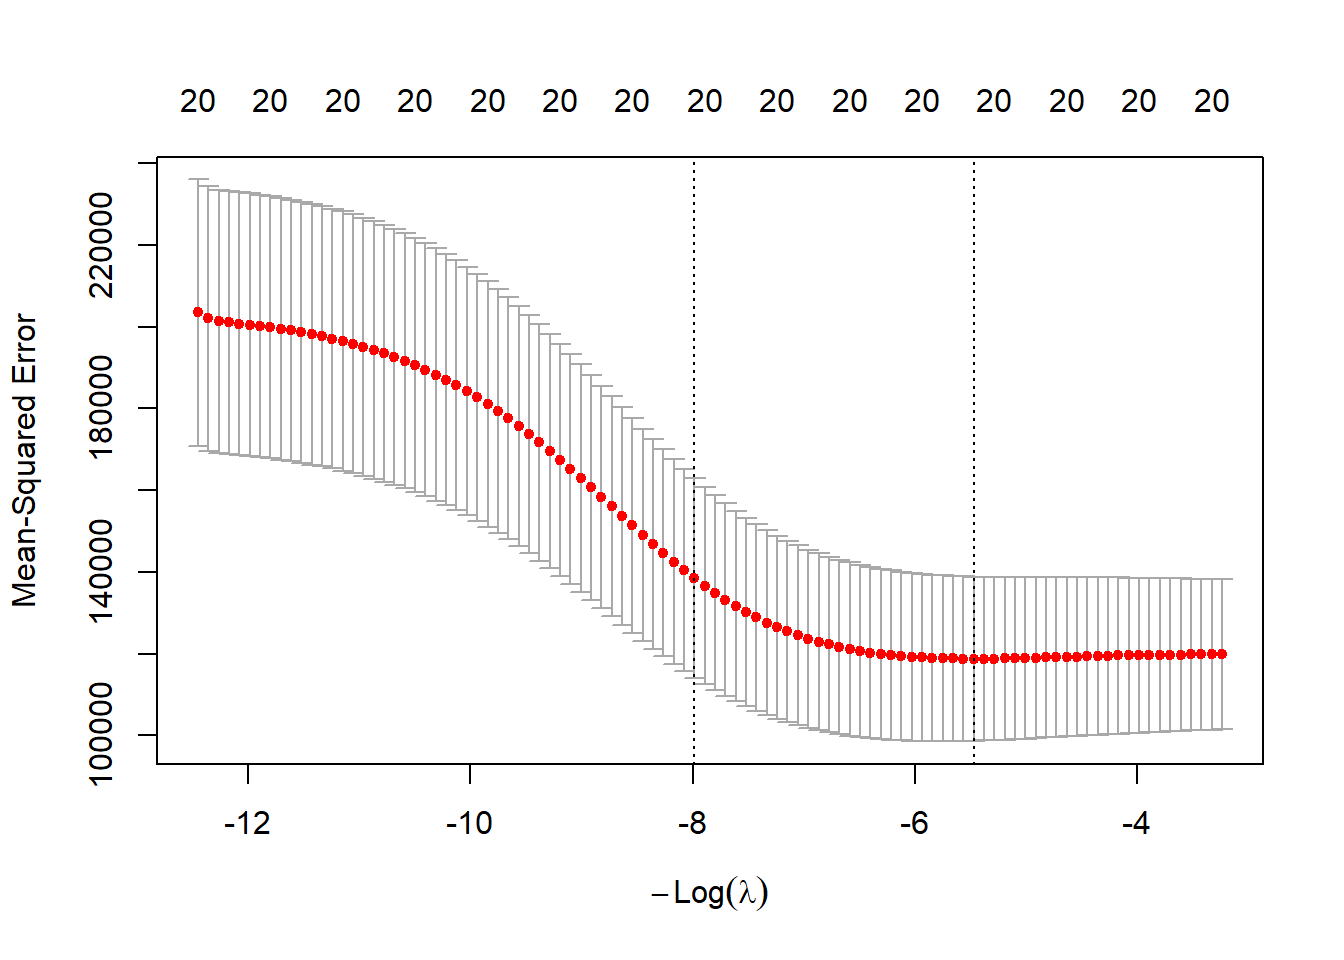
First we will fit a ridge-regression model. This is achieved by calling glmnet with alpha=0 (see the helpfile). There is also a cv.glmnet function which will do the cross-validation for us.
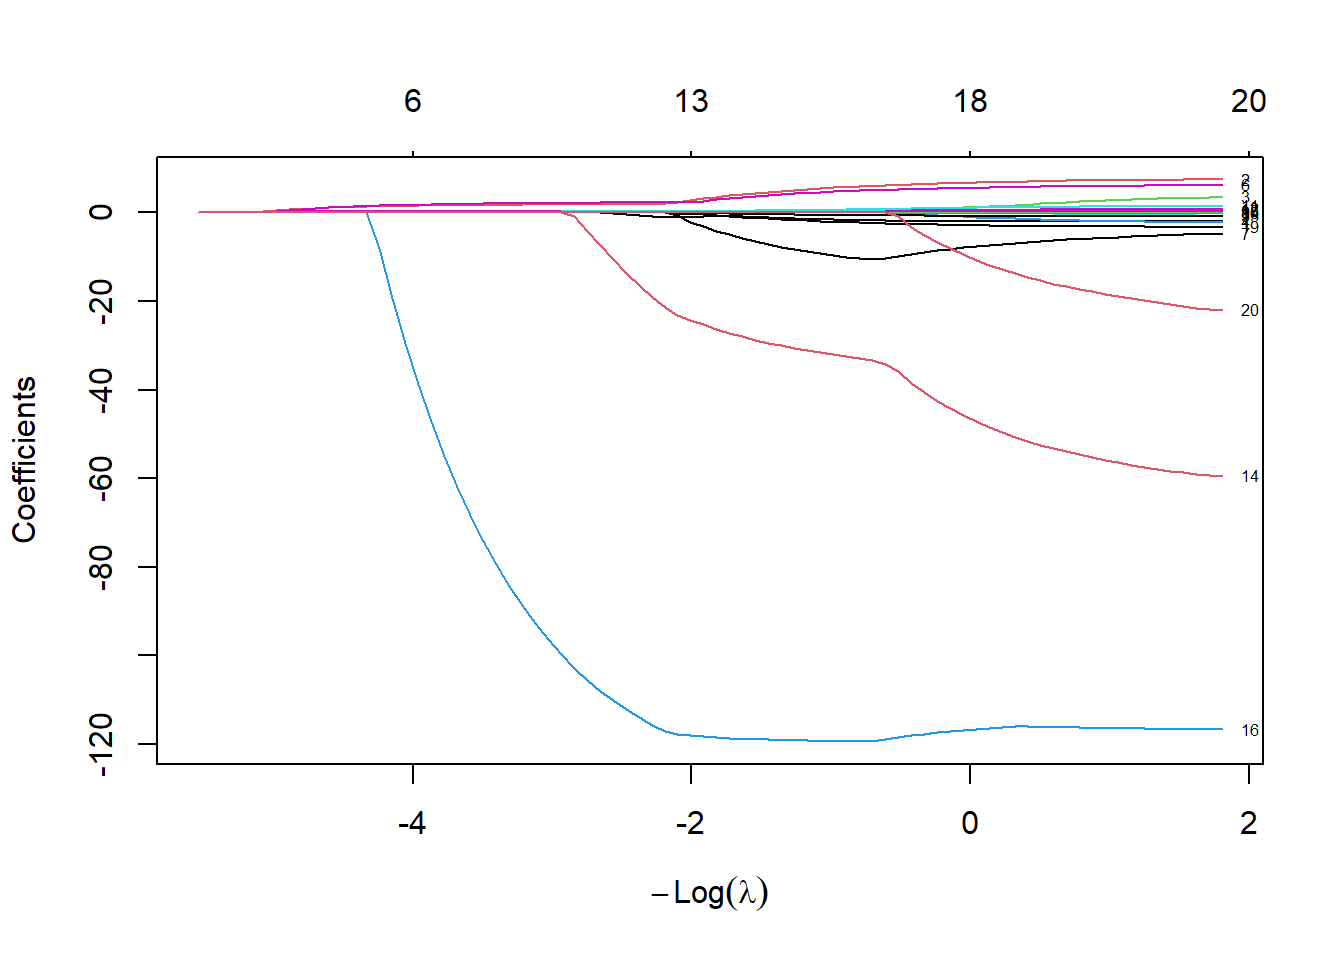
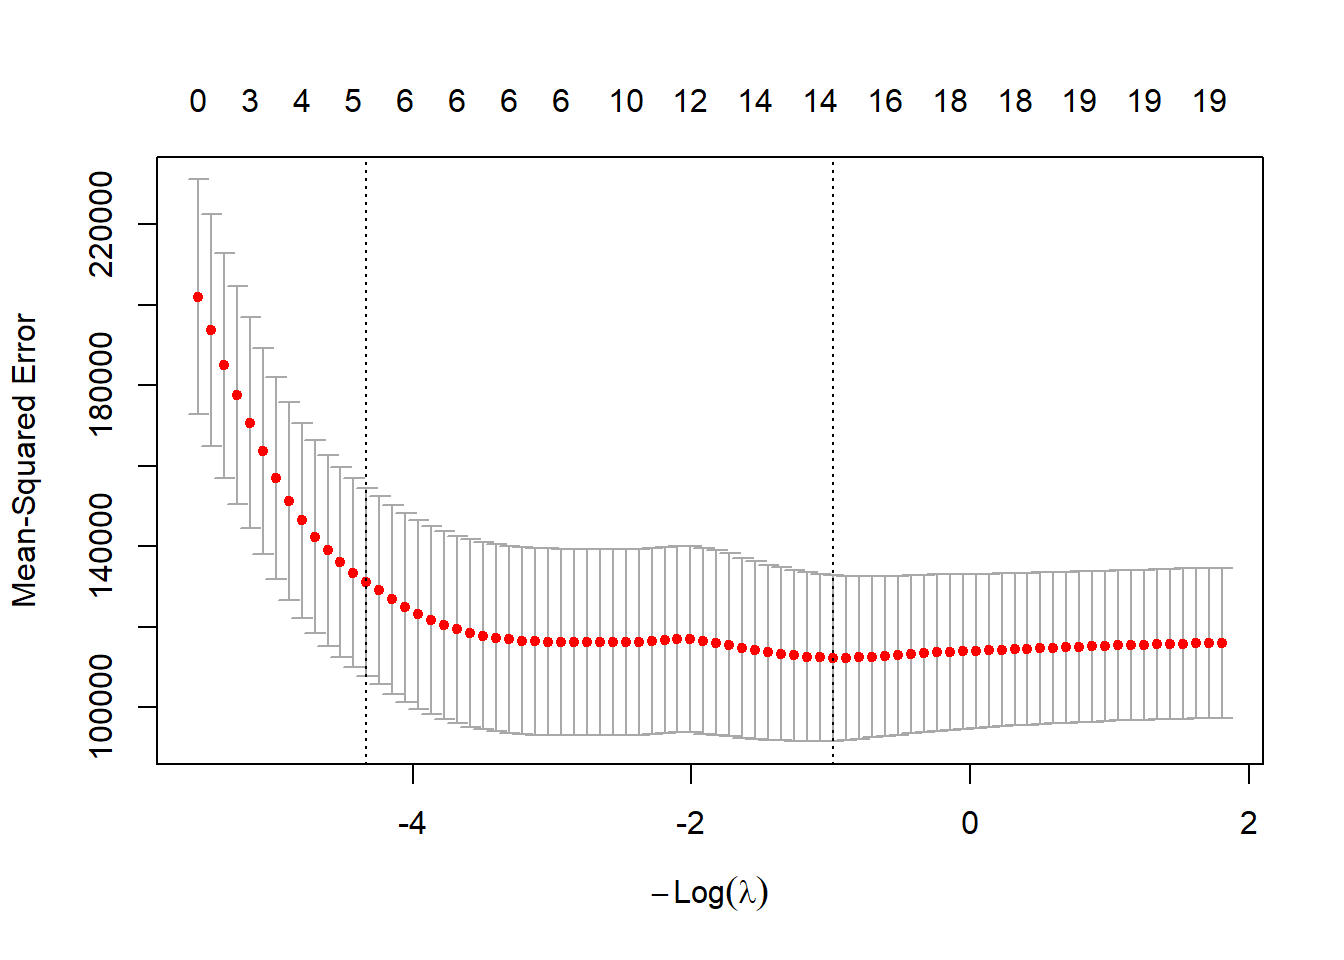
= glmnet (x,y,alpha= 0 )plot (fit.ridge,xvar= "lambda" ,label= TRUE )= cv.glmnet (x,y,alpha= 0 )plot (cv.ridge)= glmnet (x,y)plot (fit.lasso,xvar= "lambda" ,label= TRUE )= cv.glmnet (x,y)plot (cv.lasso)
21 x 1 sparse Matrix of class "dgCMatrix"
              lambda.1se
(Intercept) 144.37970458
AtBat         .
Hits          1.36380384
HmRun         .
Runs          .
RBI           .
Walks         1.49731098
Years         .
CAtBat        .
CHits         .
CHmRun        .
CRuns         0.15275165
CRBI          0.32833941
CWalks        .
LeagueA       .
LeagueN       .
DivisionW     .
PutOuts       0.06625755
Assists       .
Errors        .
NewLeagueN    .
Suppose we want to use our earlier train/validation division to select the lambda for the lasso. This is easy to do.
= glmnet (x[train,],y[train])
Call:  glmnet(x = x[train, ], y = y[train])

   Df  %Dev  Lambda
1   0  0.00 262.100
2   1  5.92 238.800
3   1 10.83 217.600
4   1 14.91 198.300
5   2 19.72 180.600
6   3 23.94 164.600
7   3 27.45 150.000
8   3 30.37 136.700
9   3 32.79 124.500
10  3 34.80 113.500
11  4 36.50 103.400
12  5 38.77  94.190
13  6 40.90  85.820
14  6 42.73  78.200
15  6 44.25  71.250
16  6 45.51  64.920
17  6 46.55  59.150
18  6 47.42  53.900
19  6 48.14  49.110
20  6 48.74  44.750
21  6 49.24  40.770
22  6 49.65  37.150
23  6 49.99  33.850
24  7 50.28  30.840
25  7 50.51  28.100
26  9 50.71  25.610
27  9 50.94  23.330
28  9 51.12  21.260
29  9 51.28  19.370
30  9 51.41  17.650
31  9 51.52  16.080
32  9 51.60  14.650
33  9 51.68  13.350
34 10 51.75  12.170
35 10 51.99  11.080
36 11 52.23  10.100
37 11 52.44   9.202
38 12 52.64   8.385
39 12 52.82   7.640
40 12 52.97   6.961
41 12 53.09   6.343
42 12 53.19   5.779
43 13 53.28   5.266
44 15 53.53   4.798
45 15 53.83   4.372
46 16 54.06   3.984
47 17 54.45   3.630
48 17 54.79   3.307
49 17 55.06   3.013
50 17 55.29   2.746
51 18 55.48   2.502
52 18 55.65   2.280
53 18 55.78   2.077
54 18 55.89   1.892
55 19 56.00   1.724
56 19 56.16   1.571
57 19 56.30   1.432
58 20 56.42   1.304
59 20 56.53   1.189
60 20 56.63   1.083
61 20 56.71   0.987
62 20 56.77   0.899
63 20 56.83   0.819
64 20 56.88   0.746
65 20 56.92   0.680
66 20 56.95   0.620
67 20 56.98   0.565
68 20 57.00   0.514
69 20 57.02   0.469
70 20 57.04   0.427
71 20 57.05   0.389
72 20 57.06   0.355
73 20 57.07   0.323
74 20 57.08   0.294
75 20 57.08   0.268
76 20 57.09   0.244
77 20 57.09   0.223
78 20 57.10   0.203
79 20 57.10   0.185
80 20 57.11   0.168
81 20 57.11   0.154
82 20 57.11   0.140
83 20 57.11   0.127
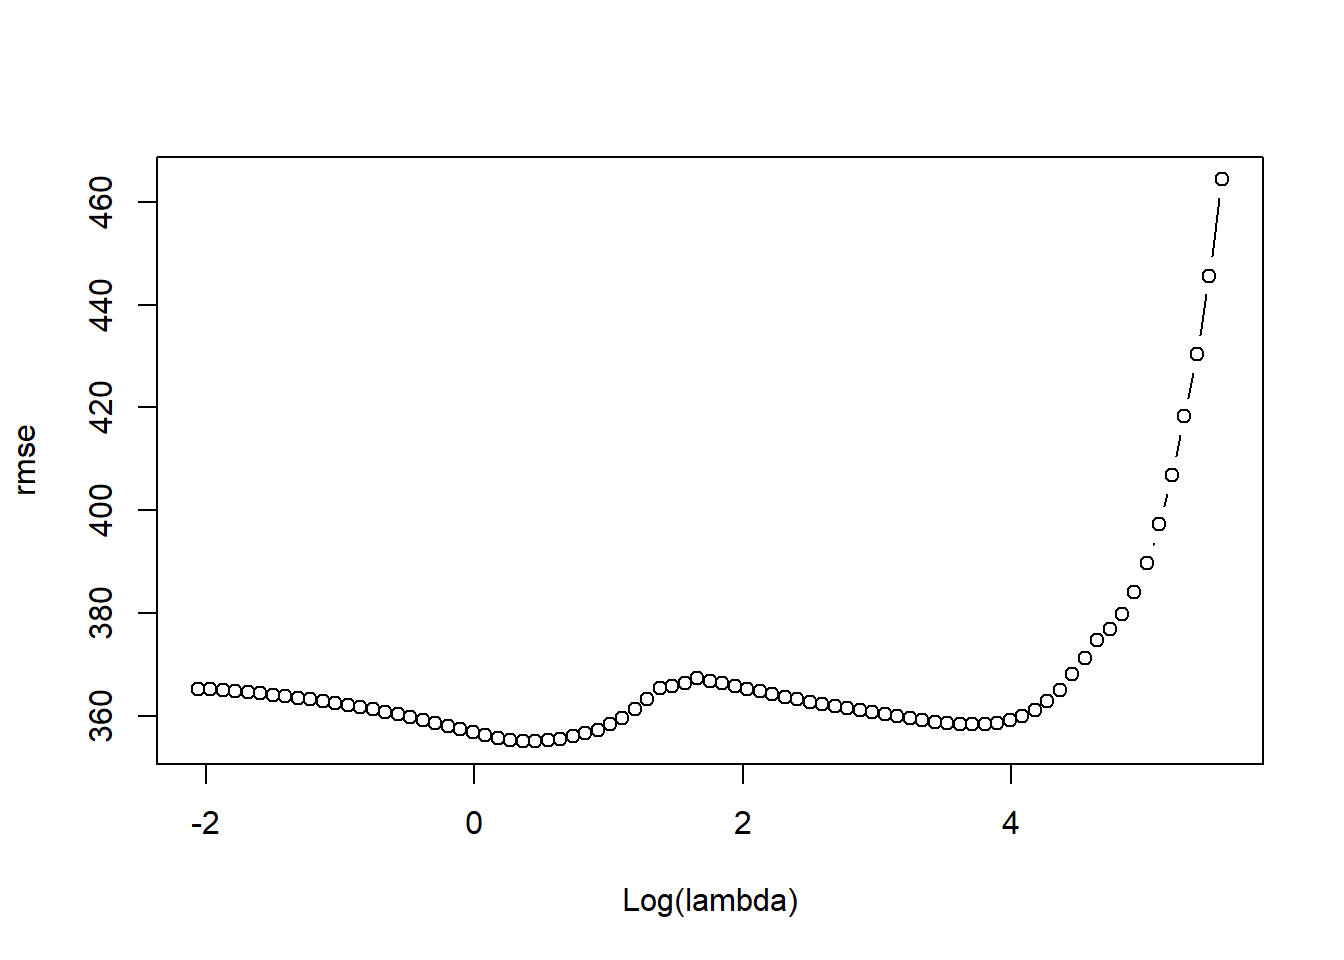
= predict (lasso.tr,x[- train,])dim (pred)= sqrt (apply ((y[- train]- pred)^ 2 ,2 ,mean))plot (log (lasso.tr$ lambda),rmse,type= "b" ,xlab= "Log(lambda)" )= lasso.tr$ lambda[order (rmse)[1 ]]coef (lasso.tr,s= lam.best)
21 x 1 sparse Matrix of class "dgCMatrix"
               s=1.571184
(Intercept)  2.842274e+02
AtBat       -1.148300e+00
Hits         4.929017e+00
HmRun        .
Runs        -3.519369e+00
RBI          3.830901e-01
Walks        6.018286e+00
Years       -2.074174e+01
CAtBat      -1.903175e-02
CHits        8.077424e-02
CHmRun       5.349380e-01
CRuns        7.727275e-01
CRBI         4.920397e-01
CWalks      -4.745867e-01
LeagueA     -9.121313e+01
LeagueN      1.339800e-10
DivisionW   -1.611022e+02
PutOuts      2.863923e-01
Assists      2.924556e-01
Errors      -4.692374e+00
NewLeagueN  -5.695409e+01