#install.packages("ISLR")
library(ISLR)

library(dplyr)
Attaching package: 'dplyr'
The following objects are masked from 'package:stats':

    filter, lag
The following objects are masked from 'package:base':

    intersect, setdiff, setequal, union
library(ggplot2)

Adv<-read.csv("Advertising.csv",header = TRUE)

summarise(Adv)
data frame with 0 columns and 1 row
par(mfrow=c(3,1))

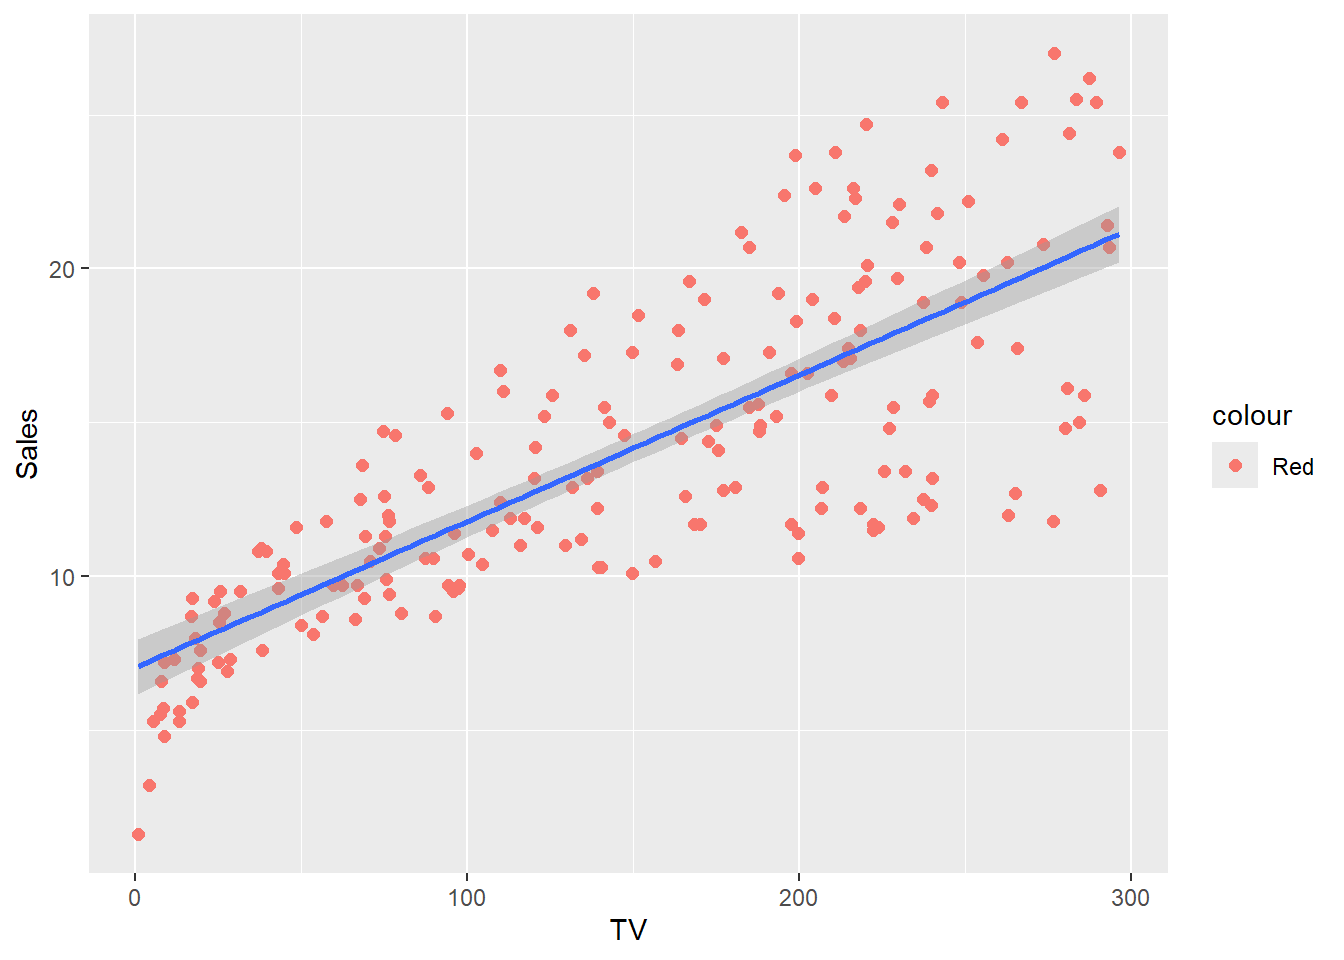
ggplot(Adv)+aes(TV,Sales)+geom_point(size=2, aes(color="Red"))+stat_smooth(method = lm)
`geom_smooth()` using formula = 'y ~ x'
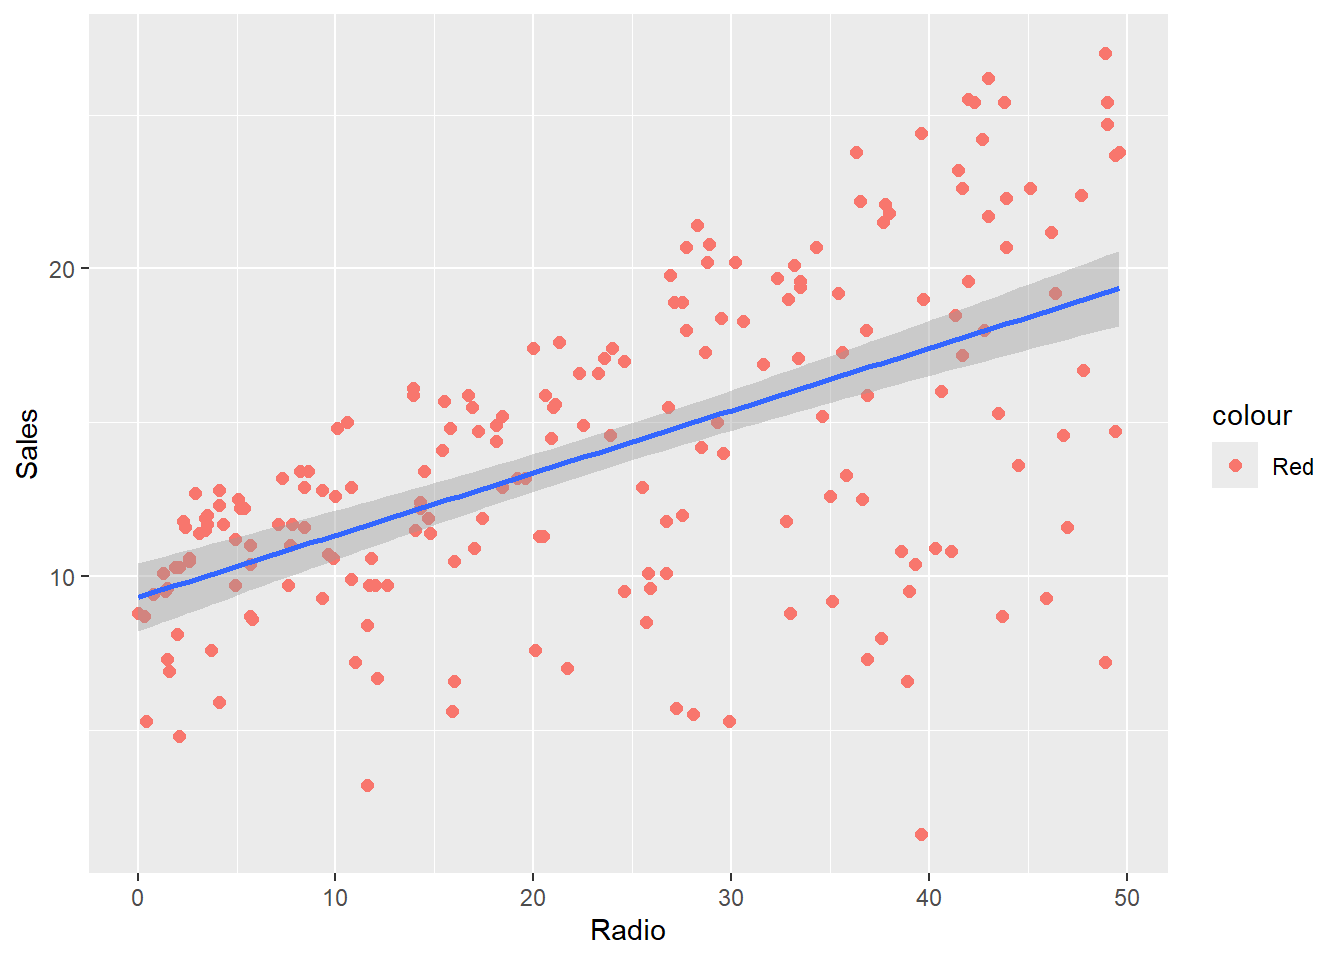
ggplot(Adv)+aes(Radio,Sales)+geom_point(size=2, aes(color="Red"))+stat_smooth(method = lm)
`geom_smooth()` using formula = 'y ~ x'
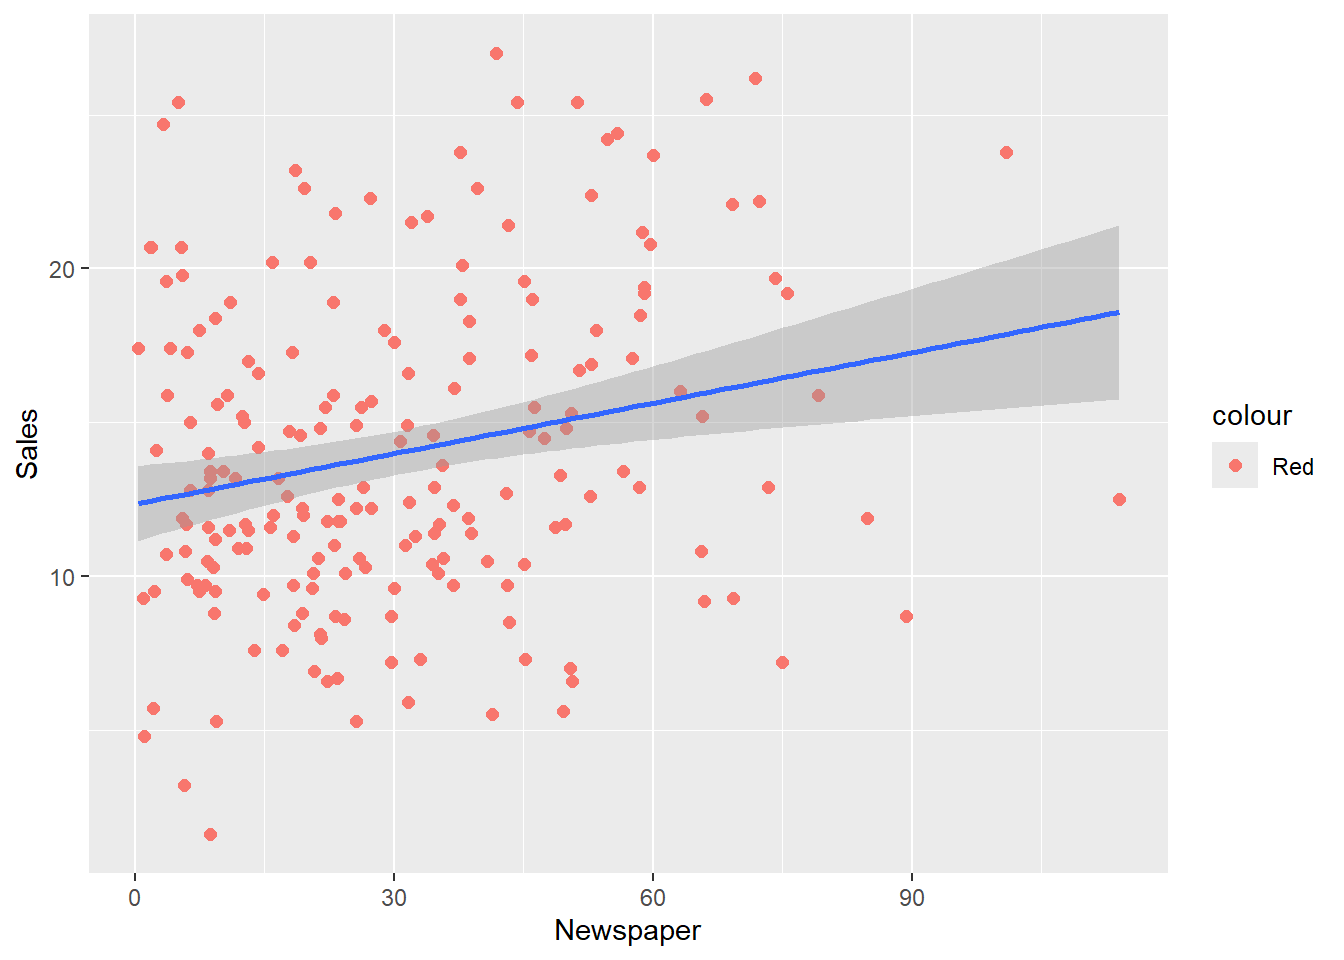
ggplot(Adv)+aes(Newspaper,Sales)+geom_point(size=2, aes(color="Red"))+stat_smooth(method = lm)
`geom_smooth()` using formula = 'y ~ x'
Now we would see which medium of advertisement has stronger relationship with Sales